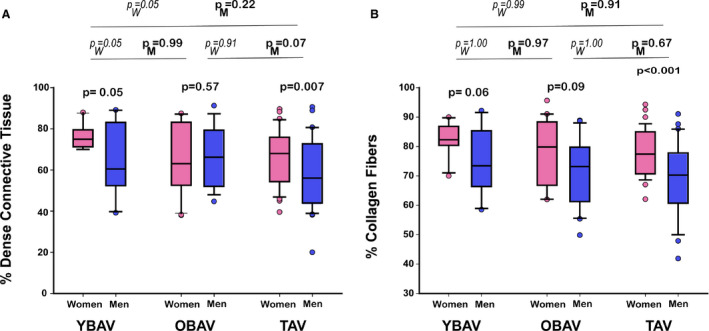
Figure 5. Histological assessment of matched stenotic valves.

Box plot graphs showing (A) dense connective tissue proportion by Masson's trichrome staining and (B) collagen fibers proportion by Picrosirius red staining. In each age group, percentage of dense connective tissue and percentage of collagen fibers are higher in women than in men, while significance is reach only in TAV patients and YBAV patients for dense connective tissue. The percentage of dense connective tissue appear to be higher in YBAV, especially in women, while the percentage of collagen was equivalent in each group according to sex of the patient. Box plot format: the box indicates the 25th to 75th percentiles; the line within the box indicates the median; and the whiskers indicate the 10th to 90th percentiles. OBAV indicates older patients with bicuspid aortic valve; PM, P‐value between men groups; PW, P value between women groups; TAV, tricuspid aortic valve; and YBAV, younger patients with bicuspid aortic valve.
