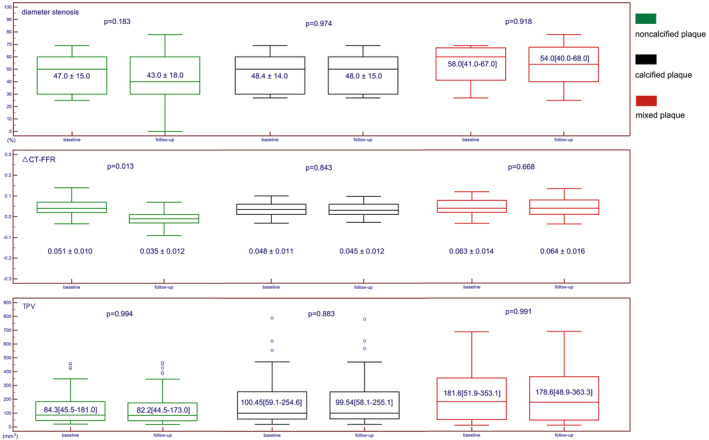
Figure 2. Box plot showing the dynamic change of diameter stenosis, △CT‐FFR and total plaque volume after statin treatment in different subgroups.

CT indicates computed tomography; FFR, fractional flow reserve; and TPV, total plaque volume.

CT indicates computed tomography; FFR, fractional flow reserve; and TPV, total plaque volume.