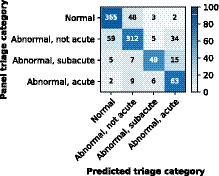
Figure 3. Confusion matrix for the deep neural network. Rows represent the categories given by the reference standard (expert panel), and columns represent the categories predicted by the deep neural network.

The color map is normalized per row and represents the percentage in the true triage category.
