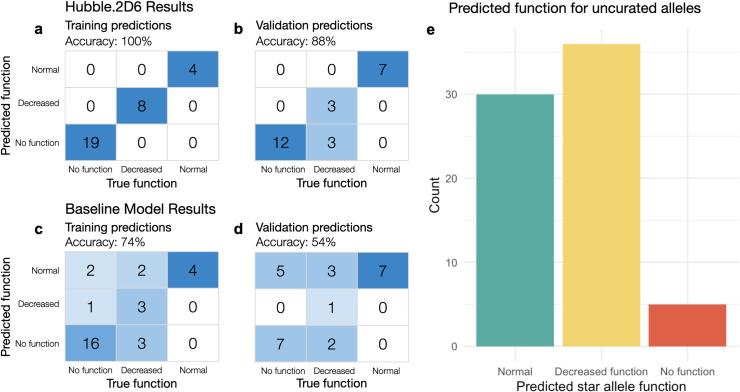
Fig 2. Star allele classification results.
The figure depicts performance metrics for the prediction of star allele function in the training and validation sets; confusion matrices for class prediction in training and validation are shown in (a) and (b), for Hubble.2D6 and in (c) and (d) for the baseline model. (e) shows the frequency of predicted function for uncurated star alleles.

