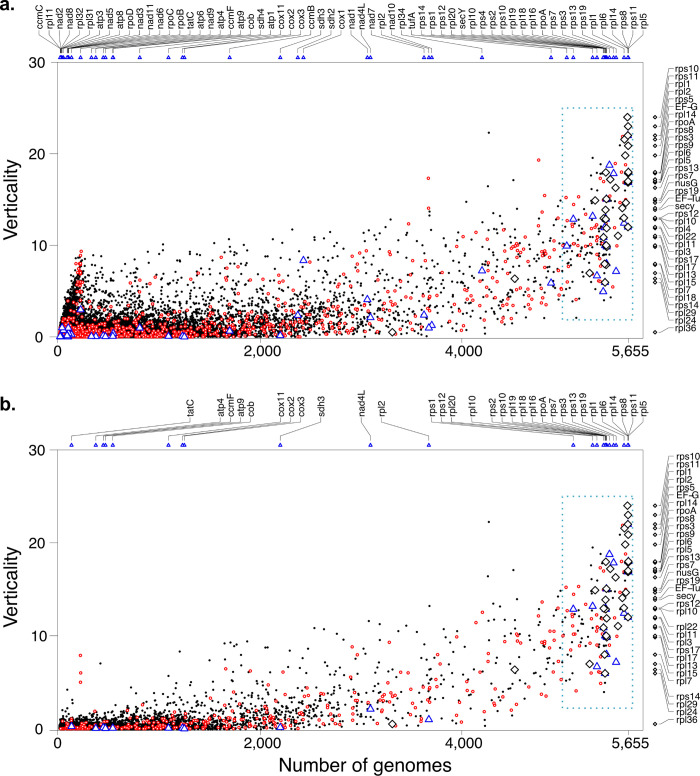
Fig 1.
Comparison of estimated verticality and number of genomes in a protein cluster for a. all clusters (n = 101,422) and b. all conserved clusters (average branch length ≥ 0.1; n = 8,547). Unrooted trees were analyzed if at least two taxonomic groups were present. Verticality was calculated as the sum of monophyletic taxonomic groups in a cluster adjusted by the fraction of a taxonomic group represented in the cluster. The procedure for determining verticality on the basis of an example is shown in S3 Fig. This value correlates with the number of genomes, an approximation of universality, which is even more apparent when clusters of high evolutionary rate were filtered out (a.: p < 10−300, Pearson´s R2 = 0.726; b.: p < 10−300, R2 = 0.829). In both plots clusters of special interest were marked: The eukaryotic-prokaryotic clusters (EPCs) are highlighted in red and the clusters that correspond to a gene from the mitochondrial genome of Reclinomonas americana [45] are displayed in blue triangles along the abscissa of the plot and in the graph. For the latter, the gene identifier was noted above each plot. Ribosomal proteins are indicated by the black diamond on the right of each plot and in the graph [6]. Notably, the ribosomal protein clusters show a steep gradient of verticality among conserved clusters with similarly wide distribution.

