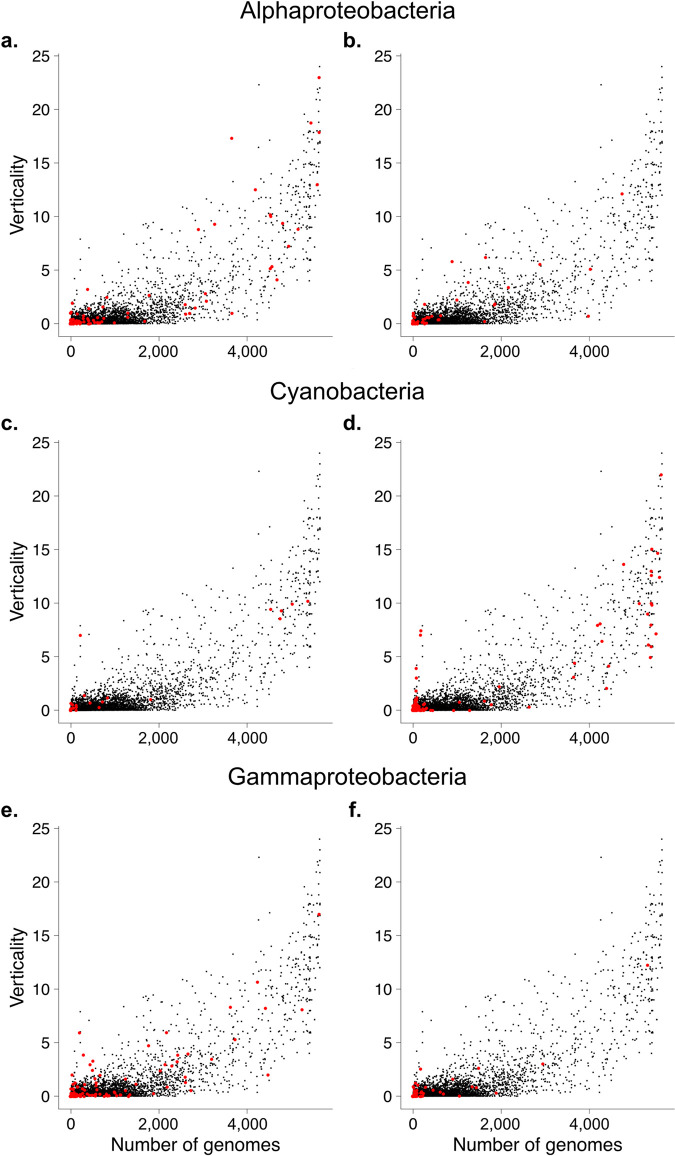
Fig 5.
Mapping of EPCs to prokaryotic clusters. The EPCs were separated according to the pure sister group of eukaryotes in the unrooted trees: a. and b. Alphaproteobacteria, c. and d. Cyanobacteria, e. and f. Gammaproteobacteria. The left panel shows EPCs that may include all eukaryotic supergroups but no groups that include only photosynthetic lineages, the right panel shows only EPCs that only include photosynthetic eukaryotes (lineages from SAR, Hacrobia and Archaeplastida). Meaning the latter are indicative of plastid endosymbiosis. Plots for all taxa see S5 Fig.

