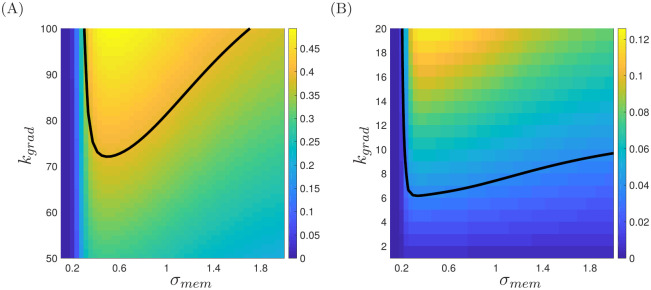
Fig 6. Plots of the mean chemotactic index attained for each combination of kgrad and σmem.
In (A), we calibrate our model against the healthy control data of [10] using a mean cell velocity of 3.77 μm/min; the black line represents a mean chemotactic index of 0.39. In (B), we calibrate our model against the COPD-affected data of [10] using a mean cell velocity of 0.09 μm/min; the black line represents a mean chemotactic index of 0.04.

