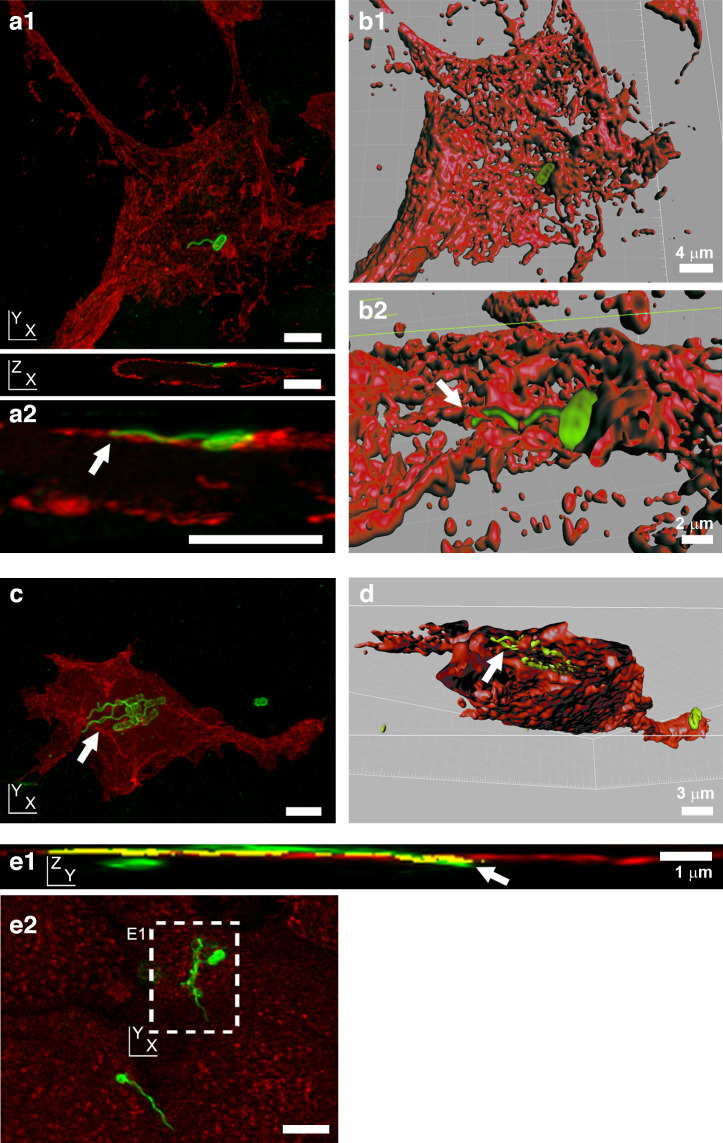
Fig. 3.
Position of E. coli O157:H7 and S. Typhimurium flagella relative to host cell membranes, as determined by confocal microscopy. (a, c) Projections of 3D confocal micrographs of E. coli O157:H7 (TUV93-0: LPS and flagella are green) interacting with HEK293 cells transiently transfected with a transmembrane protein–fluorescent protein fusion construct (red, see the Methods section) 1.5 h post-infection. This transfection causes labelling of the cytoplasmic face of the plasma membrane cytosolic leaflet [39]. (b, d) 3D volume-rendered model of images in (a) and (c), respectively, using Volocity Visualization software. Arrows indicate intracellular flagella. (a1) XY and XZ projections of a single flagellum emanating from a bacterium on a transfected HEK293 cell, 3D-rendered in (b1) and enlarged in (a2). A similar view has been 3D-rendered in (b2), where the arrow indicates intracellular flagella. (c) XY projection of the binding of a cluster of bacteria expressing H7 flagella to a transfected HEK293 cell. (d) Transverse cut-through of the HEK293 cell, with flagella visible beneath the layer defined by the cytoplasmic staining of the labelled ion channel protein (arrow). (e) Projections of a 3D confocal micrograph of O4:P2 stained S. Typhimurium SL1344 (green) interacting with wheat germ agglutinin-labelled IPEC-J2 cells (red) 10 min post-infection. This labelling stains N-acetylglucosamine and sialic acid moieties on the external face of cell membranes [38]. (e1) YZ projection of the XY inset labelled in (e2), with a long flagella bundle that passes out then back into the cell (arrow). Coincidence of flagella and membrane staining is shown in yellow. (e2) XY projection of whole image shown in (e1). All samples were fixed in 4 % (w/v) para-formaldehyde for >20 min prior to permeabilization. Scale bars, 5 µm unless indicated otherwise.

