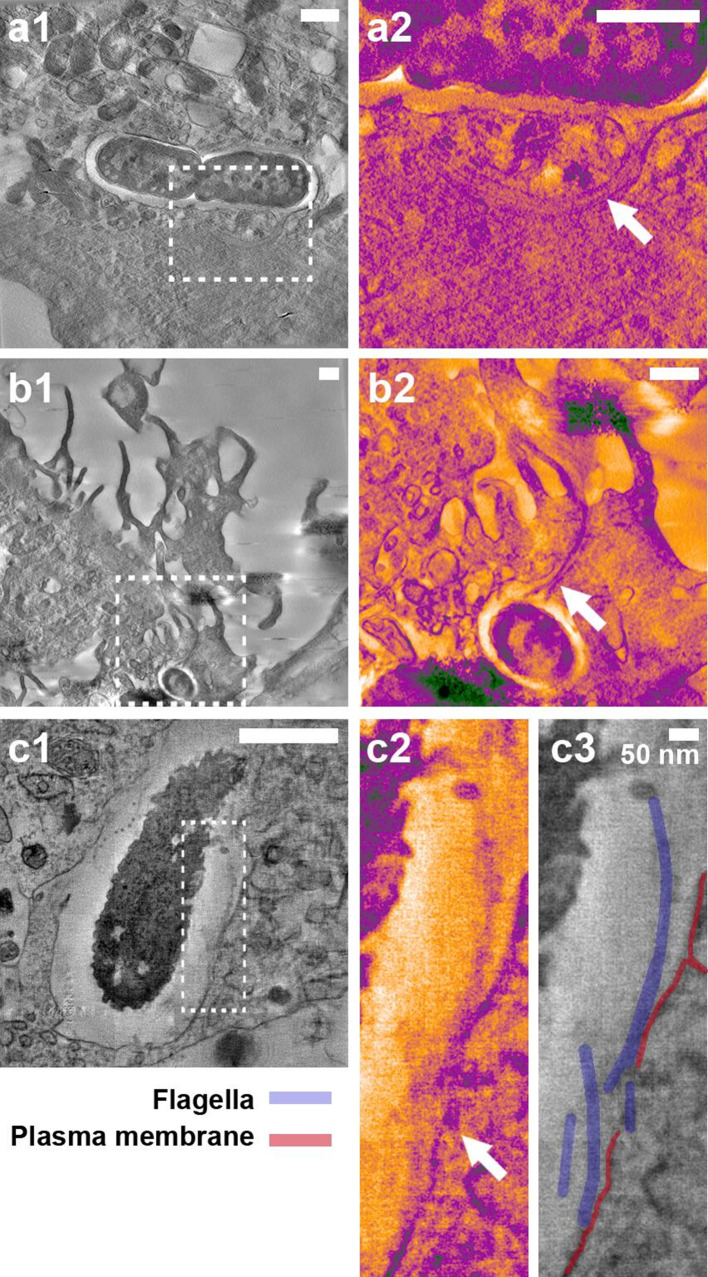
Fig. 5.
Electron tomography of host cell membranes in proximity to S. Typhimurium flagella-like structures. S. Typhimurium SL1344::pAJR145 interacting with IPEC-J2 cells 20 min post-infection. Fixation with 4 % (w/v) paraformaldehyde was undertaken for >20 min prior to flagella labelling and samples were not treated with any detergents. Confocal microscopy was used to locate bacteria with flagella in contact with host cells and correlative electron tomography was undertaken (see the Methods section). The contrast of insets was enhanced using the blue_orange_ICB look-up table in Fiji software. (a1) Flagellated S. Typhimurium within an epithelial cell. (a2) Inset in (a1); the flagella cross the gross vacuole boundary but are present inside an intact membrane channel (arrow). (b1) Flagellated S. Typhimurium inside a membrane ruffle. (b2) Inset in (b1); the flagella bundle passes through the gross boundaries of the ruffle but is adjacent to a distinct membrane boundary (arrow). (c1) Flagellated S. Typhimurium at the point of induced uptake into an epithelial cell. (c2) Inset in (c1); flagella in proximity to the disrupted epithelial plasma membrane (arrow). (c3) Structures in (c2) are labelled for clarity. Scale bars, 500 nm unless indicated otherwise.

