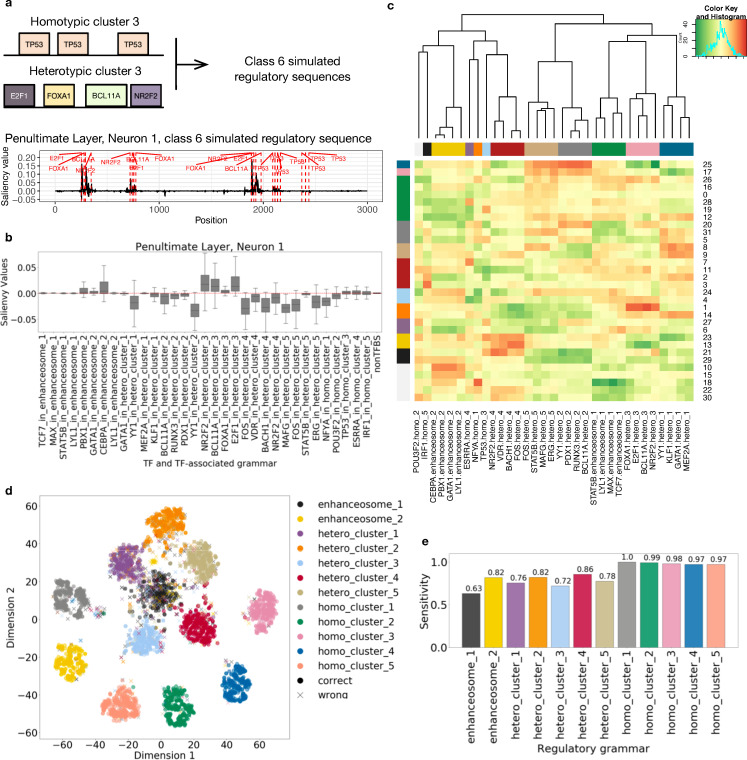
Fig 2. ResNet trained on simulated regulatory sequences and TF-shuffled negatives accurately models the regulatory grammar.
(a) Example saliency map for a simulated regulatory sequence from class 6. Class 6 sequences harbor instances of homotypic cluster 3 and heterotypic cluster 3. The saliency map shown is computed with respect to neuron 1 in the penultimate layer. The red dashed lines show simulated TFBSs in their respective regulatory grammars. (b) The saliency values of the binding sites of each TF in a specific regulatory grammar with respect to neuron 1 in the penultimate layer. (c) Heatmap of the median saliency value of the binding sites of each TF in a specific regulatory grammar (x axis) across neurons of the penultimate layer (y axis). The order of x and y axis labels are determined by hierarchical clustering. The color bars on the side indicate the group label assigned by hierarchical clustering. (d) Actual labels of simulated regulatory grammar of the TFBS overlaid on t-SNE visualization of TFBS saliency values across neurons. Correct prediction of the regulatory grammar for a TF (the predicted label agrees with the actual label) is represented by a dot. Incorrect prediction of the regulatory grammar of a TF is indicated by an “x”. (e) The sensitivity (TP/(TP+FN)) of the regulatory grammar predictions.

