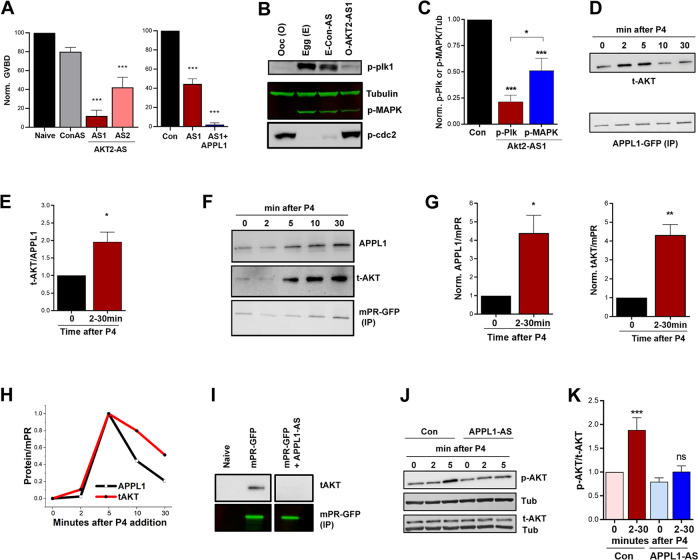
Fig 3. Akt2 is required for mPR signaling.
(A) Oocyte maturation in response to P4 in untreated oocytes (Naive), oocytes injected with Con-AS oligos, oocyte injected with 2 different Akt2 antisense oligos (AS1 or AS2) (left panel), and in oocytes injected with Akt2-AS1 oligos with overexpression of APPL1 (1+APPL1) (50 ng/oocyte) (right panel). GVBD percentage is normalized to naive (mean ± SEM; n = 3–5 donor females). (B) Activation of the MAPK and Plk1 cascades in untreated oocytes (O), untreated eggs matured with P4 (E), eggs injected with Con-AS oligos and matured with P4 (E-Con-AS), or oocytes injected with Akt2 antisense oligos and treated with P4 (O-AKT-AS1). For the O-AKT-AS1 group immature oocyte with no white spot where collected when the control group has reached maximal GVBD levels. (C) Quantification of p-Plk1 and p-MAPK for the conditions in panel (B) as the ratio of p-Plk1 or p-MAPK to Tub, normalized to untreated eggs (Con) (mean ± SEM; n = 7). (D) IP over a P4 time course using overexpressed APPL1-GFP (20 ng/oocyte) as a bait and probed for t-AKT. (E) Quantification of Akt pulldown for the IP experiments in (D) as the ratio of t-AKT/APPL1-GFP. The maximal response between 2 to 30 minutes from each experiment is plotted (mean ± SEM; n = 5). (F) IP over a P4 time course using overexpressed mPR-GFP (20 ng/oocyte) as a bait and probed for APPL1 and total Akt. (G) Quantification of the IP experiments in (F) as the ratio of t-Akt/mPR-GFP. The max response between 2 to 30 minutes from each experiment is plotted (mean ± SEM; n = 5). (H) Normalized amounts of APPL1 and t-AKT that immunoprecipitate with mPR-GFP over time from a single experiment. (I) IP of mPR-GFP probed for t-AKT from oocytes expressing mPR-GFP without or with injection of APPL1 antisense oligos (mPR-GFP + APPL1-AS). (J) Western blot analysis of t-AKT and phospho-Akt S473 (p-AKT) over a P4 time course without (Con), or with APPL1 antisense oligos injection (APPL1-AS). Tub is used as a loading control. (K) Quantification of p-AKT for the conditions in panel (J). Maximal phospho/total Akt ratio between 2 to 30 minutes from each experiment is plotted. p-AKT and t-AKT levels were first normalized to Tub. Data are normalized to untreated oocytes (time 0) (mean ± SEM; n = 6 donor females). *p < 0.05, ** p < 0.01, ***p < 0.001. Refer to S1 Data file. APPL, adapter protein containing Pleckstrin homology domain, Phosphotyrosine binding domain and Leucine zipper motif 1; AS, antisense; Con-AS, control antisense oligos; GFP, green fluorescent protein; GVBD, germinal vesicle breakdown; IP, immmunoprecipitation; MAPK, mitogen-activated protein kinase; mPR, membrane progesterone receptor; ns, not significant; P4, progesterone; Plk1, Polo-like kinase 1; PTB, phosphotyrosine-binding domain; t-AKT, total Akt; Tub, tubulin; WT, wild type.

