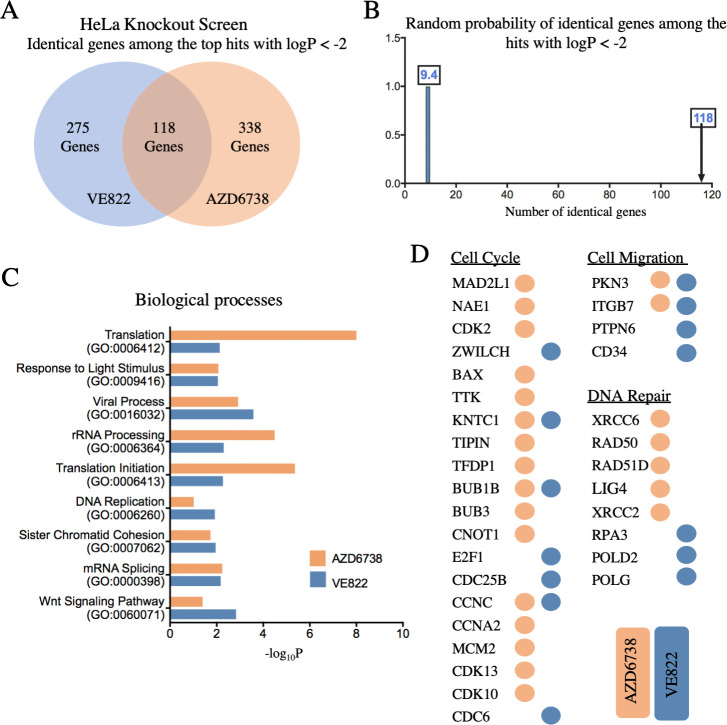
Fig 2. Pathway analysis reveals biological pathways involved in resistance to AZD6738 and VE822 from the CRISPR knockout screens.
(A) Diagram showing the overlap of identical genes within the top hits from both screens with logP values lower than -2.0. (B) The number of common genes within the top hits with logP values lower than -2.0 (namely 118) is much higher than the random probability of identical hits, which is 9.4. (C) Biological pathways that were significantly enriched within the top hits with logP values lower than -2.0 from both ATRi screens using Gene Ontology analysis. (D) Genes within the top hits with logP values lower than -2.0 of each ATRi screen that are involved in the indicated biological processes.

