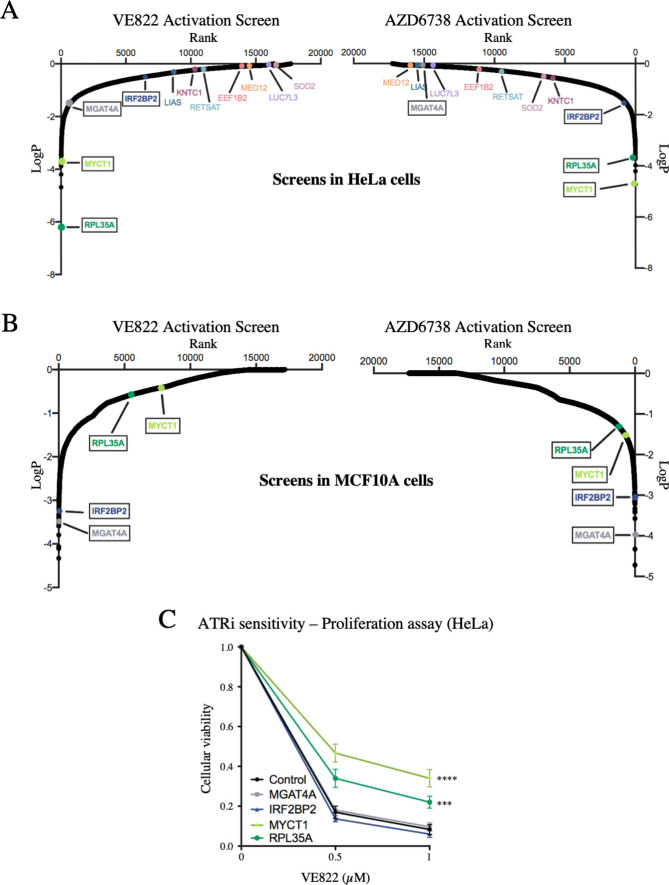
Fig 9. Validation of the CRISPR activation screens for ATRi resistance.
(A) Scatterplot showing the results of the ATRi activation screens in HeLa cells. Each gene targeted by the library was ranked according to P-values calculated using RSA analysis. The P-values are based on the fold change of the guides targeting each gene between the ATRi- and DMSO-treated conditions. The location of RPL35A, MYCT1, IRF2BP2 and MGAT4A is shown (in black boxes). RPL35A and MYCT1 were top hits in both ATRi HeLa screens, whereas IRF2BP2 and MGAT4A were not. Also shown is the location of the seven top hits from the HeLa knockout screen described above. (B) Scatterplot showing the results of the ATRi activation screens in MCF10A cells. IRF2BP2 and MGAT4A were top hits in both ATRi screens, whereas RPL35A and MYCT1 were not. (C) Overexpression of RPL35A or MYCT1 in HeLa cells causes resistance to VE822 in a cellular proliferation assay, while overexpression of IRF2BP2 or MGAT4A does not. The average of three experiments is shown, with error bars representing standard deviations. Asterisks indicate statistical significance compared to control.

