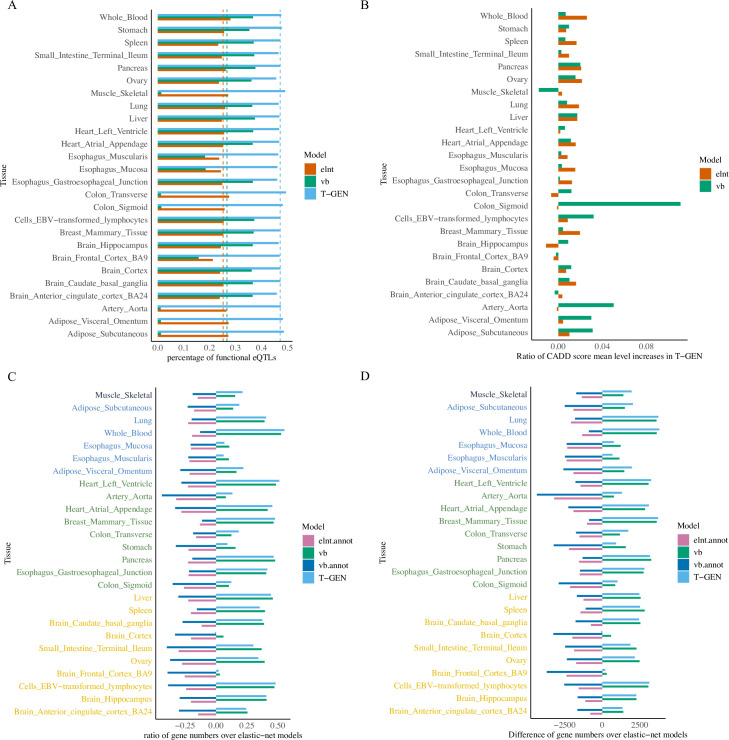
Fig 2. More SNPs with functional potential were idenfied and more imputation models were built by T-GEN.
A) compares the percentages of SNPs in gene expression imputation models having active ChromHMM15 annotated states across three different methods (elnt, vb and vb.logit) using gene expression and genotype data from GTEx in 26 tissues. The “elnt” model was built via elastic net, the “vb” model was built via a variational Bayesian method, and the “T-GEN” model was built using our method (variational bayesian method with a logit link). Across all 26 tissues, imputation models built by our method have higher percentage of SNPs with active ChromHMM annotated states (indicated by blue bars). X axis denotes the mean percentage of SNPs in imputation models having ChromHMM15 annotated states in each tissue for each models. The dotted lines are the mean values of R2 across 26 tissues for each method. B) shows the ratio of CADD score mean level increases in T-GEN compared to elnt and vb models in 26 tissues. C) shows the ratios of gene model numbers (FDR < 0.05) in each method over that in elastic net models. D) indicates the difference in the number of genes models between that from each method and that from elastic net. In C and D, different colors of each tissue indicate their sample sizes, from upper to lower: [401,501), [301, 401), [201, 301), [101, 201).

