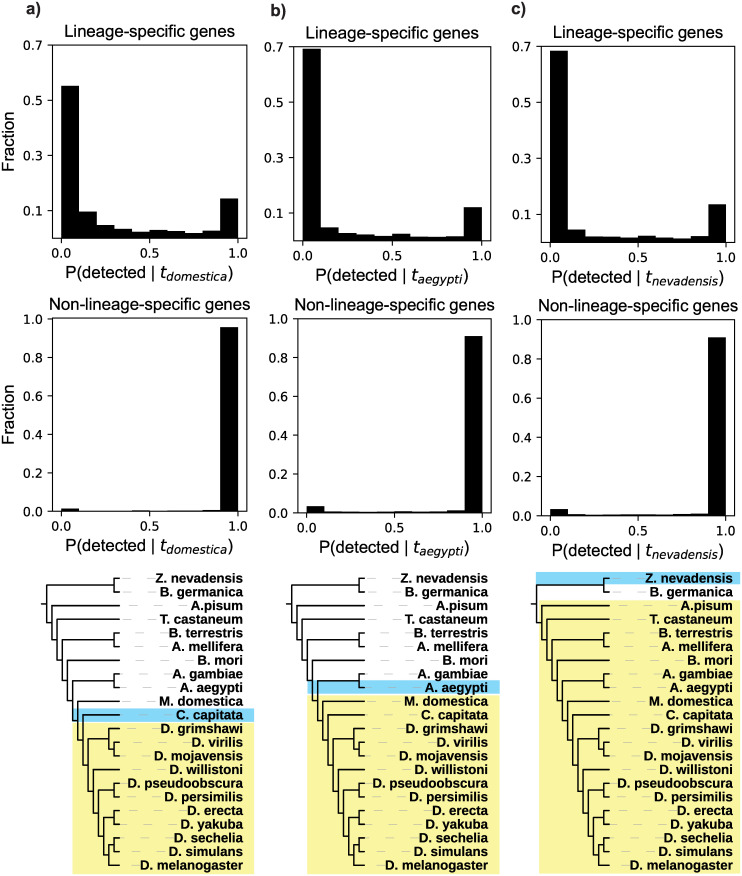
Fig 5. Distributions of detectability prediction results for 3 insect lineages (a, b, c).
Top: results for all lineage-specific genes. Middle: results of the same analysis for all non-lineage-specific genes, which serve as a positive control. These genes, which have detectable orthologs outside of the lineage, should be predicted to be detected, which they largely are. Bottom: Depiction of the lineage (yellow) and closest outgroup (blue) considered in the analyses in the corresponding column. In a), note that Ceratitis capitata is the topological outgroup to the shaded lineage, but is not the closest species by evolutionary distance (branch lengths are not to scale). Data in this figure are available at https://github.com/caraweisman/abSENSE/tree/master/Insect_Data.

