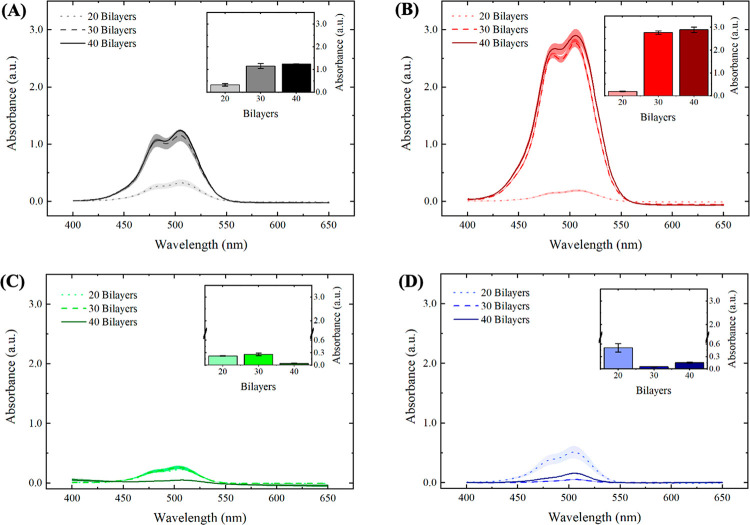
Figure 2.
Absorbance spectra for PAA/PAH films after drug loading show an increase in the amount of CAL loaded for the postassembly drug loading method and a pH-dependent drug loading behavior for the during-assembly drug loading method. UV–visible spectra for PAA/PAH films assembled at (A) pH 4.5 and (B) pH 8.8 with CAL loaded after film assembly, and at (C) pH 4.5 and (D) pH 8.8 with CAL loaded during film assembly. Insets represent the absorbance peak at 505 nm. Shaded areas and error bars represent the standard error values.

