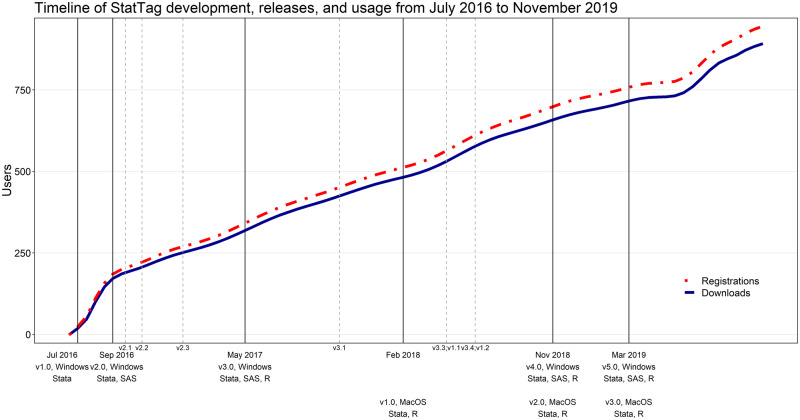
Figure 3.
Timeline of StatTag development, releases, and usage from July 2016 to November 2019. The number of registrations at stattag.org are shown in red; the number of registrations that also included a download of StatTag are shown in blue. Solid vertical lines indicate “major” releases, such as addition of a statistical software program or substantial redesign of the user interface. Dashed vertical lines indicate “minor” releases, which include smaller changes such as improving speed or addressing user-reported issues.

