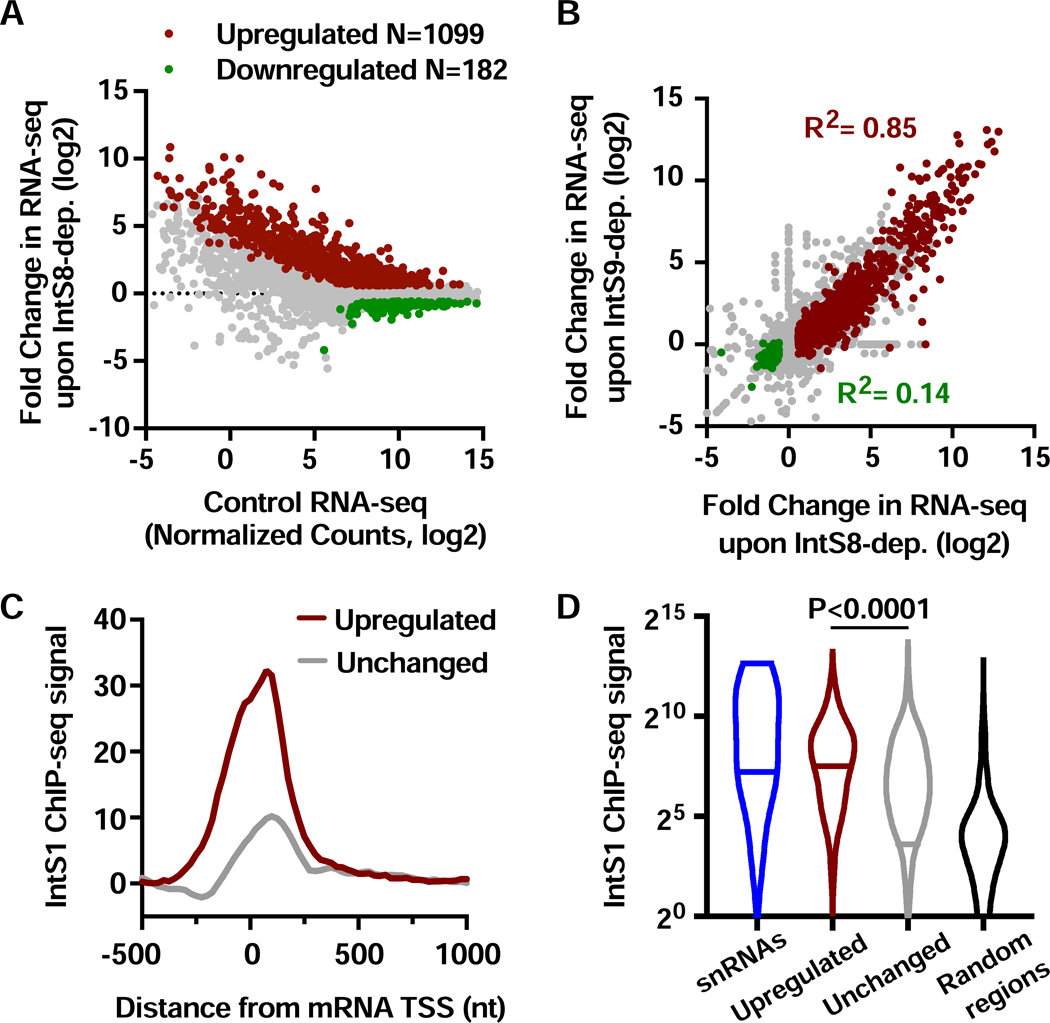
Figure 1. Depletion of IntS8 causes widespread activation of genes bound by Integrator.
(A) DL1 cells were treated with dsRNA targeting IntS8 or ß-galactosidase (Control) for 60 h and RNA isolated for total RNA-seq (n=3 per condition). Normalized counts and fold changes are shown for mRNA genes with no alteration in splicing patterns under these conditions (N=9303). Affected genes show a fold-change > 1.5 and adjusted P value <0.0001.
(B) Comparison of fold changes in RNA-seq signals between cells depleted of IntS8 and IntS9. Pearson correlations are shown for genes upregulated (red) or downregulated (green) upon depletion of IntS8.
(C) Composite metagene analysis of IntS1 ChIP-seq reads around promoters of mRNA genes upregulated (N=1009) or unchanged (N=8022) upon IntS8-depletion. Data are shown as average reads per gene in 25-bp bins.
(D) Promoter-proximal read counts for IntS1 ChIP-seq were summed around snRNAs (N=31), randomly selected regions (N=5000) or promoters upregulated or unchanged by IntS8-depletion, as in C. Violin plots depict the range of values, with median indicated by a line. P value calculated using a Mann-Whitney test.

