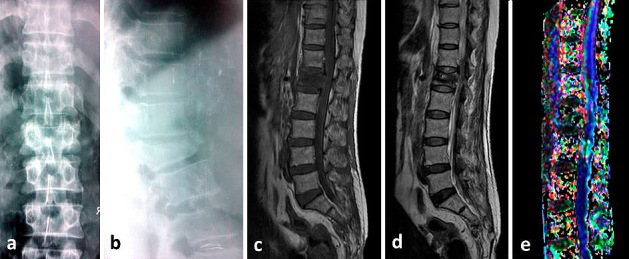
Figure 2.

Plain radiographs anteroposterior (a) & lateral (b) at 3 months follow-up. The patient improved neurologically to AIS (ASIA impairment scale) D. Conventional MRI T1-weighted (c) and T2-Weighted (d) sagittal sections shows improvement in spinal cord edema & hemorrhage. Fiber tractography (e) shows disruption of the fibers. Values of FA, ADC and AI were 0.458, 1.40, and 0.318 respectively.
