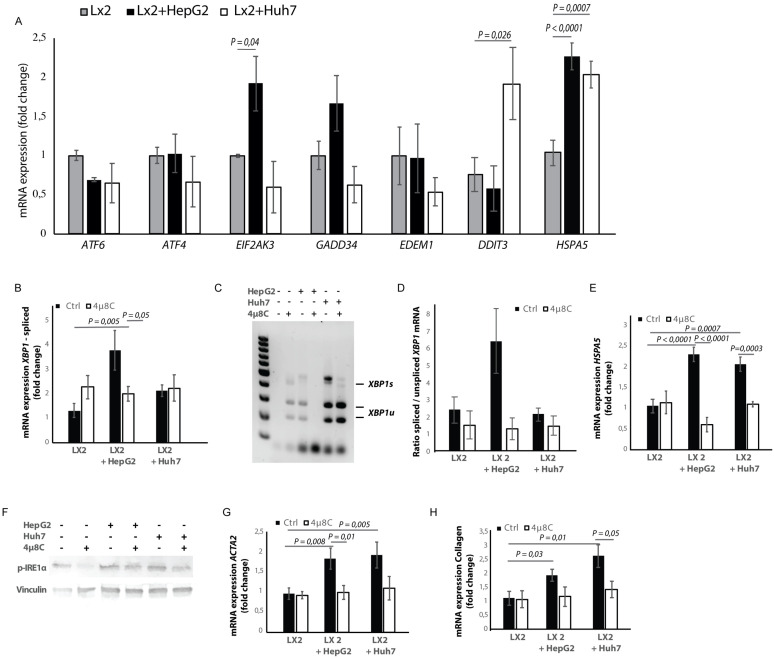
Figure 4. Tumor cells secrete factors that induce ER-stress in stellate cells, which contributes to their activation.
(A) mRNA-expression of ER-stress markers ATF6, ATF4, EIF2AK3, GADD34, EDEM1, DDIT3 and HSPA5, in stellate cells (LX2) co-cultured with cancer cells (HepG2 or Huh7) and treated with 4μ8C or control. (B) Detection of spliced (XBP1s) and unspliced XBP1 (XBP1u) via qPCR and (C) via digestion of the XBP1u-RT-qPCR product by Pst-I and subsequent visualization by separation of on agarose gel. (D) Quantified ratio of spliced and unspliced measured on agarose gel after digestion by Pst-I (E) mRNA expression of HSPA5 in stellate cells (LX2) co-cultured with cancer cells (HepG2 or Huh7) and treated with 4μ8C or control. (F) protein expression of p-IRE1α and vinculin in stellate cells (LX2) co-cultured with cancer cells (HepG2 or Huh7) in transwell assays and treated with 4μ8C or control. (G) mRNA-expression of stellate cell activation markers ACTA2 and (H) collagen in LX2-cells co-cultured with HepG2 or Huh7-cells and treated with or without 4μ8C. p-Values were calculated via ANOVA with 10 biological replicates per group.


