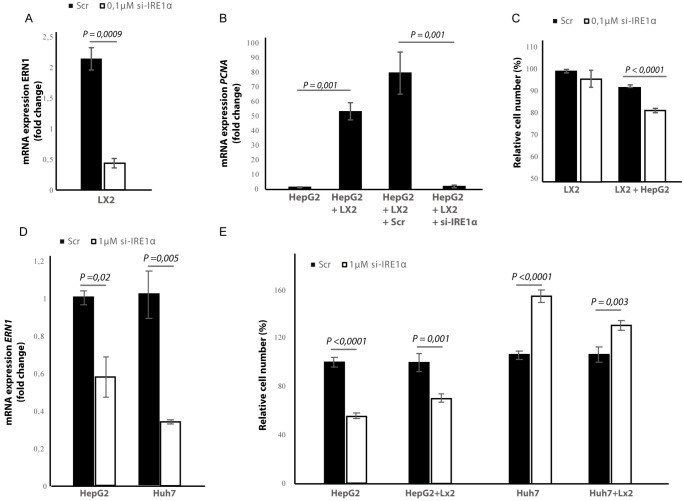
Figure 9. Silencing IRE1α in LX2-cells mimics 4μ8C.
(A) ERN1-mRNA-expression of LX2-cells transfected with IRE1α-siRNA (si-IRE1α) or mock-transfected (Scr) (B) PCNA-mRNA-expression of HepG2-cells co-cultured with IRE1α-silenced LX2-cells or controls (C). Relative cell numbers in co-cultures of HepG2-cells and IRE1α-silenced LX2-cells or controls. (D) ERN1-mRNA-expression of HepG2- and Huh7-cells transfected with IRE1α-siRNA (si-IRE1α) or mock-transfected (Scr). (E) Relative cell numbers in co-cultures LX2-cells or and si-RNE. Transfected HepG2 or Huh7 cells or mock-transfected controls (Scr). p-Values were calculated via the Student's T-test from three biological replicates per group (panel A, B and D) or six biological replicates (panel C and E).


