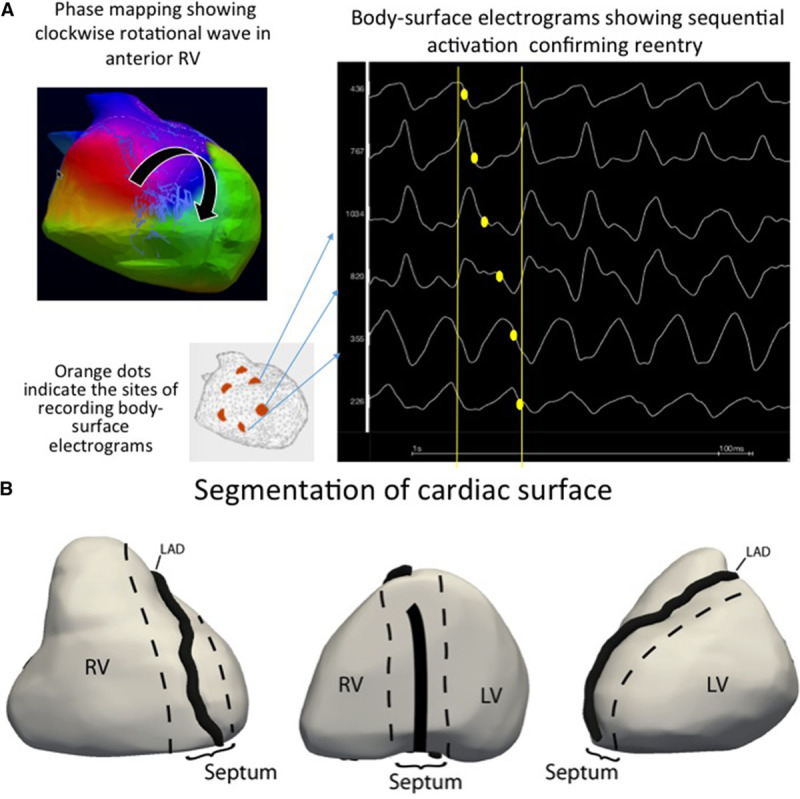
Figure 1.

Identification and location of reentrant drivers. A, Phase mapping and activation mapping. Left, Shows the color-coded phases of wave propagation. Reentrant activity is shown as full phase progression around a center-point in the anterior right ventricle (RV). Right, Shows raw unipolar electrograms recorded around the reentry trajectory which indicate corroborated sequential activation. B, Regions of epicardial heart surface. The epicardial surface is divided into 3 regions to describe anatomic distribution of driver activity. 1, Right ventricle. 2, Septum (interventricular groove). 3, Left ventricle (LV). LAD indicates left anterior descending artery.
