
Figure 5.
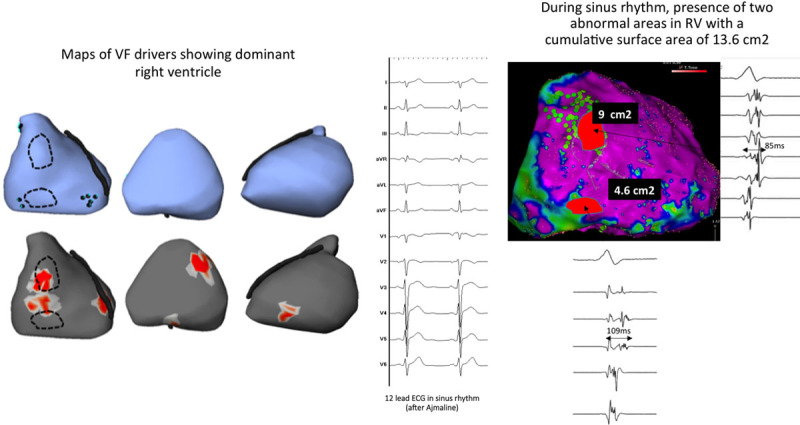
Example of abnormal signals during sinus rhythm in the right ventricle (RV, patient no. 16). Left, Maps of ventricular fibrillation (VF) sources, in anterior, inferior, and left lateral views, show focal breakthroughs in the inferior RV (blue points in blue upper) and reentry areas in the anterior RV (red areas in lower). These sources are largely dominant in the RV. Middle, Shows the 12-lead ECG before and after infusion of ajmaline demonstrating the absence of the Brugada pattern (maximal ST elevation is 0.07 mV in V1 or V2). Right, Shows the presence of abnormal signals during epicardial mapping in 3 areas in the RV; note also the heterogeneous signal timing indicating localized conduction abnormality. Abnormal signals are recorded within the black dotted contours; which colocated strikingly with those of VF drivers (red areas and blue points). No abnormal electrograms are recorded in the (smaller) left ventricular (LV) driver areas.