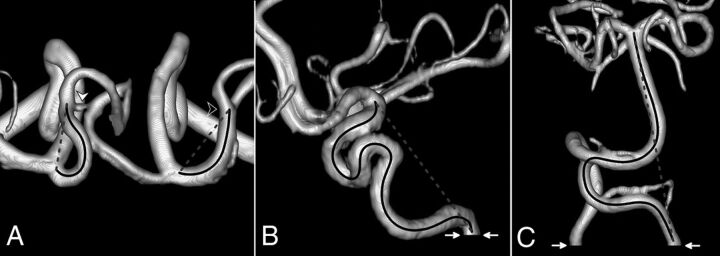
FIG 1.
The TI measurement on 3D volume-rendered TOF-MRA. The solid black line indicates the centerline length, whereas the dashed gray line shows straight-line length. A, Superior view of A1 and M1 segments in a patient with LDS (all anterior cerebral artery segments distal to A2 have been removed; white arrowhead, anterior communicating artery; black arrowhead, right M1–M2 bifurcation). B, Lateral view of the right IICA in a patient with LDS (white arrows, level of the inferior opening of the carotid canal). C, Anterior view of VBS in a patient with Marfan syndrome (white arrows, level of the foramen magnum).

