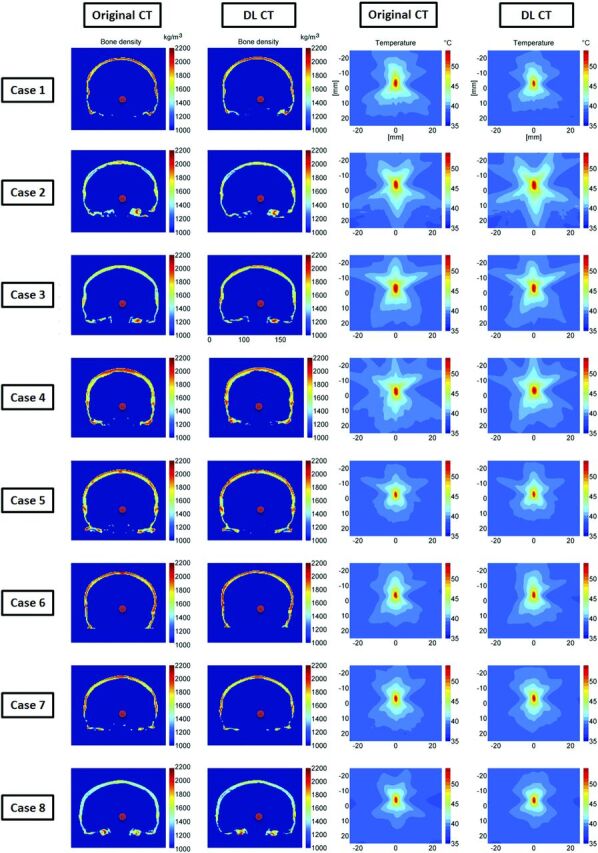
FIG 6.

Comparison of calculated bone density and the simulated temperature rise. The first and second columns show the calculated bone density map using the reference CT and DL synthetic CT images on 8 representative testing cases, in which the red dots are the assigned focal targets. In the third and fourth columns, the simulated temperature elevations at the focal spots caused by a 16-second, 1000-W sonication are compared between reference CT and DL synthetic CT on a base brain temperature of 37°C. The simulated peak temperature rise values based on original and DL synthetic CT images for all 8 subjects are the following: case 1: 55.3°C and 54.2°C (6.0% error on temperature rise), case 2: 59.0°C and 58.9°C (0.5% error), case 3: 57.6°C and 55.9°C (8.2% error), case 4: 57.5°C and 59.1°C (7.8% error), case 5: 54.3°C and 54.6°C (0.6% error), case 6: 55.5°C and 56.0°C (0.9% error), case 7: 54.5°C and 55.1°C (1.1% error), case 8: 53.5°C and 54.5°C (1.9% error), respectively. These errors are well within the errors that one might expect from the simulation.
