
Figure 8.
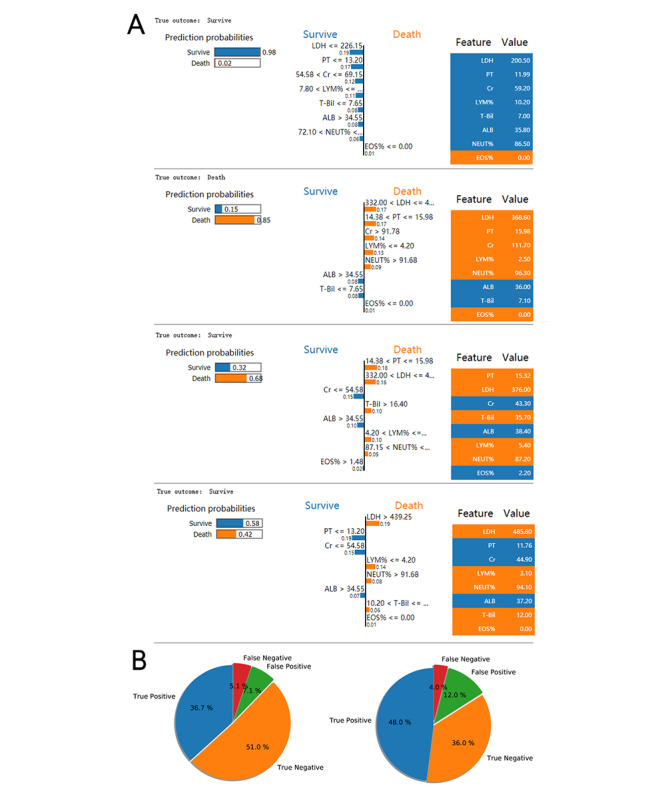
Interpretation of sample prediction results by randomly drawing samples to make model predictions and observing the model through the Local Interpretable Model-Agnostic Explanations (LIME) algorithm. (A) The four different prediction behaviors of the model (true negative, true positive, false negative, and false positive); (B) the ratios of the four prediction behaviors of the model on the training set and the test set. A:LB: albumin level; CR: creatinine: EOS%: eosinophil percentage; LDH: lactate dehydrogenase; LYM%: lymphocyte percentage; NEUT%: neutrophil percentage; PT: prothrombin time; T-Bil: total bilirubin.