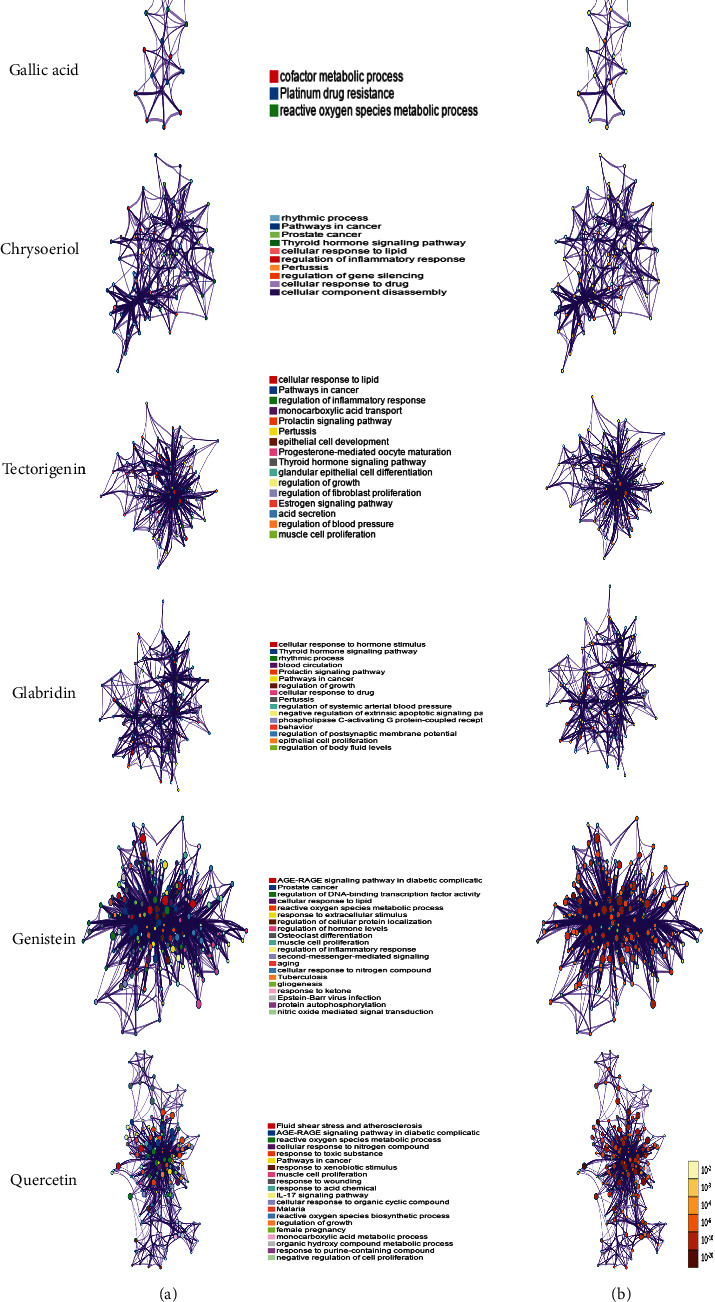
Figure 5.

Biological processes and pathways impacted by quercetin, genistein, chrysoeriol, tectorigenin, glabridin, and gallic acid, analyzed by Metascape. (a) Network of enriched terms colored by cluster identity. Nodes that share the same cluster identity are close to each other. (b) Network of enriched terms colored by p value; more genes tended to result in a more significant p value.
