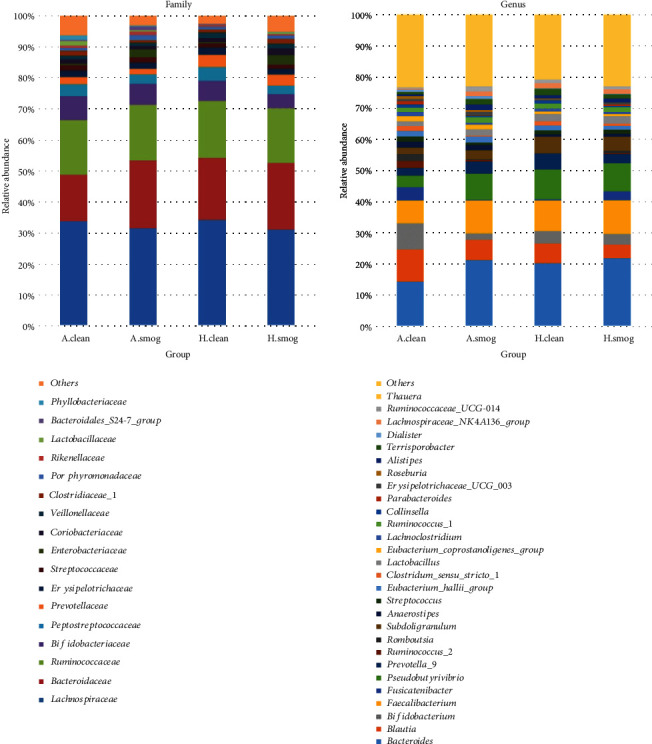
Figure 3.

Relative abundance difference of families and genera between clean and smog days. The taxa were shown in different colors; the height of bars represents relative abundance. A.clean: asthmatic children during clean days; A.smog: asthmatic children during smog days; H.clean: healthy children during clean days; H.smog: healthy children during smog days.
