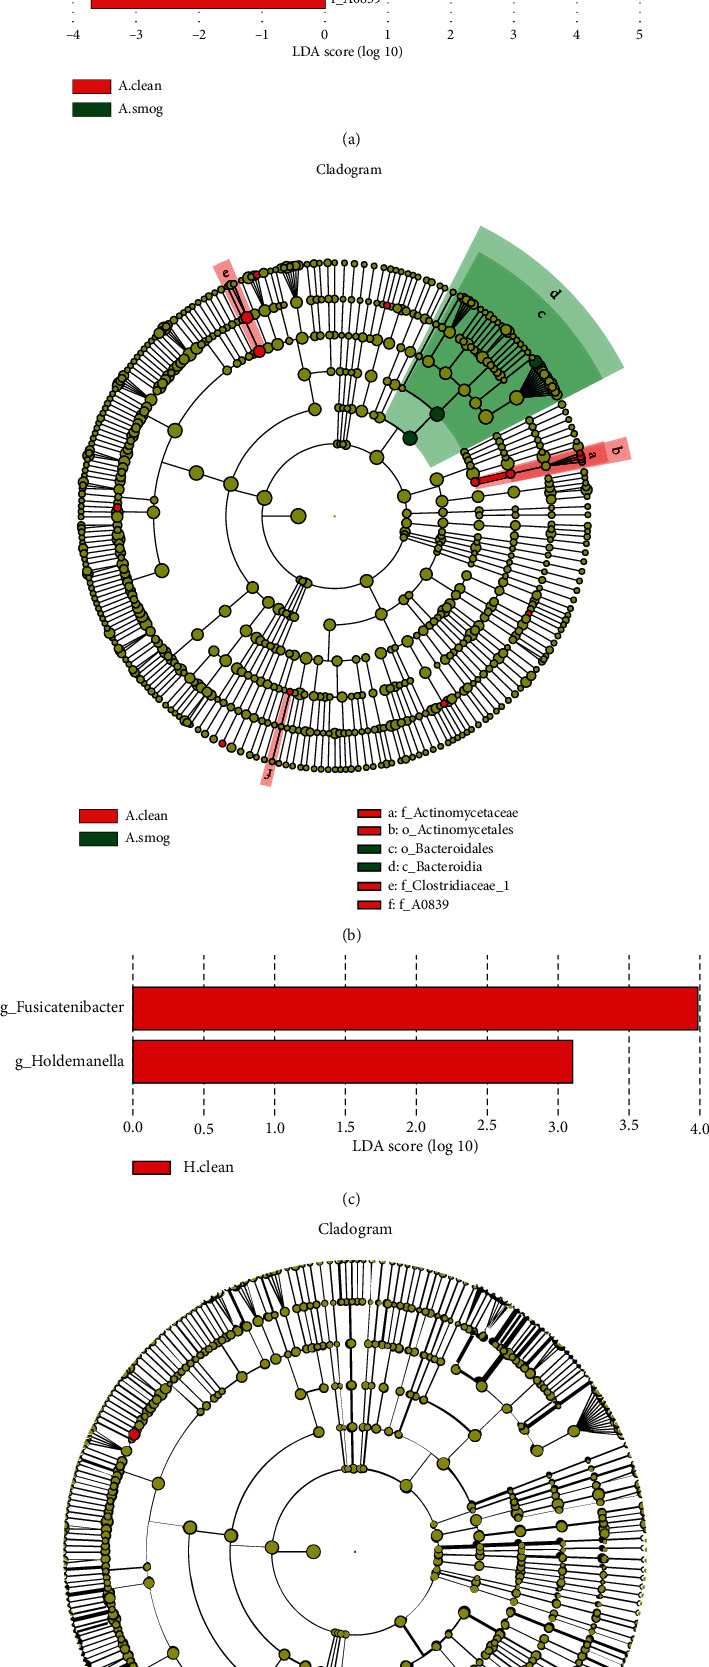
Figure 4.

Bacteria with statistical significance between clean and smog days analyzed by LEfSe. (a) LDA score for asthmatic children, (b) cladogram for asthmatic children, (c) LDA score for healthy children, and (d) cladogram for healthy children. The graph showed the LDA scores obtained from linear regression analysis of the significant microorganism groups. It distinguished the microbial communities of each group with LDA > 3 and the P value < 0.05. In the cladogram, the circle which radiated from the inside to the outside represented the classification level from the phylum to species. Each dot represented a taxon. Red dots corresponded to taxa with significant difference in clean days. Green dots corresponded to taxa with significant difference in smog days. A.clean: asthmatic children during clean days; A.smog: asthmatic children during smog days; H.clean: healthy children during clean days; H.smog: healthy children during smog days.
