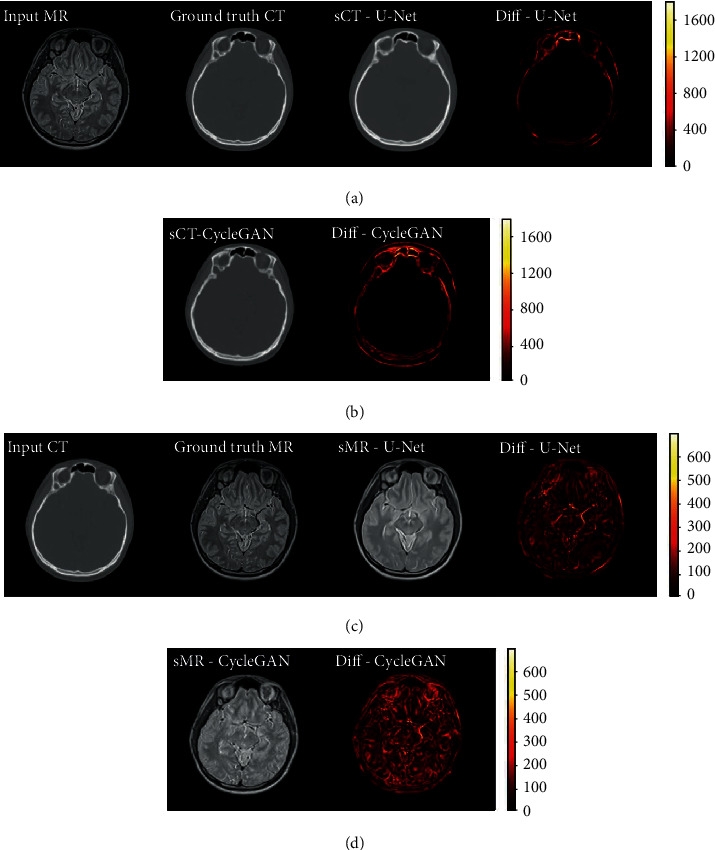
Figure 3.

(a–d) From left to right: the 4 columns are input images, ground truth images, synthetic images, and the difference maps. sCT results generated by U-Net (a) and CycleGAN (b), respectively; sMR results by U-Net (c) and CycleGAN (d), respectively.
