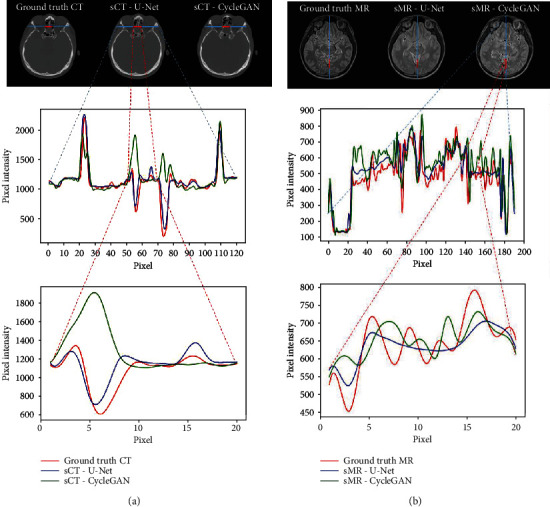
Figure 4.

Comparison of 1D profiles of pixel intensity passing through the short red lines and long blue lines as indicated in the images: (a) 1D profile and its close-up marked by the horizontal lines in ground truth CT, U-Net sCT, and CycleGAN sCT images; (b) 1D profile and its close-up marked by the horizontal lines in ground truth MR, U-Net sMR, and CycleGAN sMR images.
