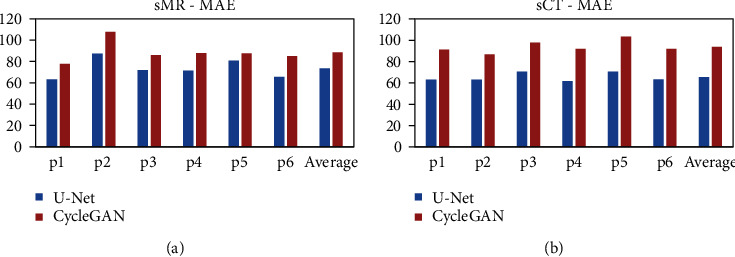
Figure 5.

(a) MAE of sMR images for all the 6 patients in test set and their average value. (b) MAE of sCT images generated for all the 6 patients in test set and their average value. Both the blue columns denoted the U-Net method, and the red columns represented the CycleGAN method.
