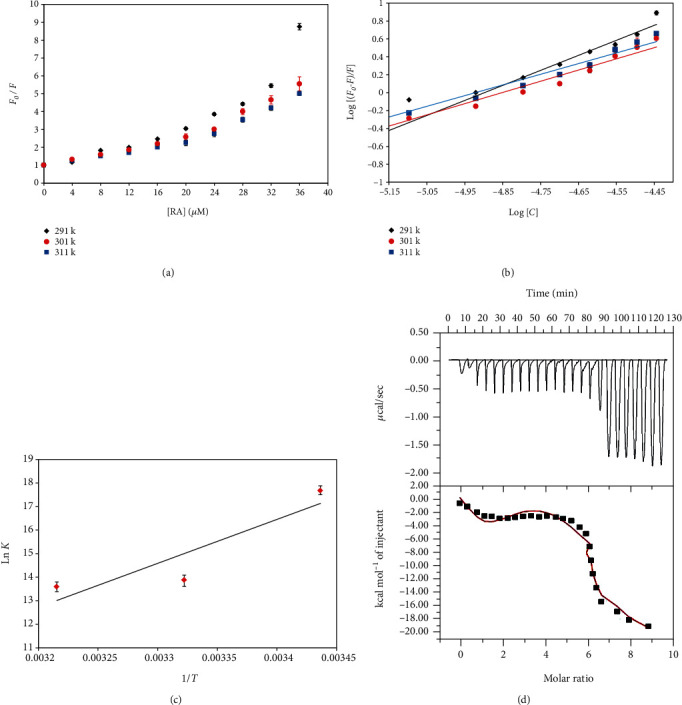
Figure 1.

(a) Stern–Volmer plots for the quenching of hTf fluorescence by RA at three different temperatures. (b) Modified Stern-Volmer plot. The experimental data fitting of double log relation at three different temperatures. (c) van't Hoff plot with the natural log of obtained binding constant at three different temperatures with the inverse of retorted temperatures on the x-axis. (d) ITC isotherm obtained after titrating RA with hTf. The four-site fit curve is displayed as a thin line. Experiments were done in triplicate.
