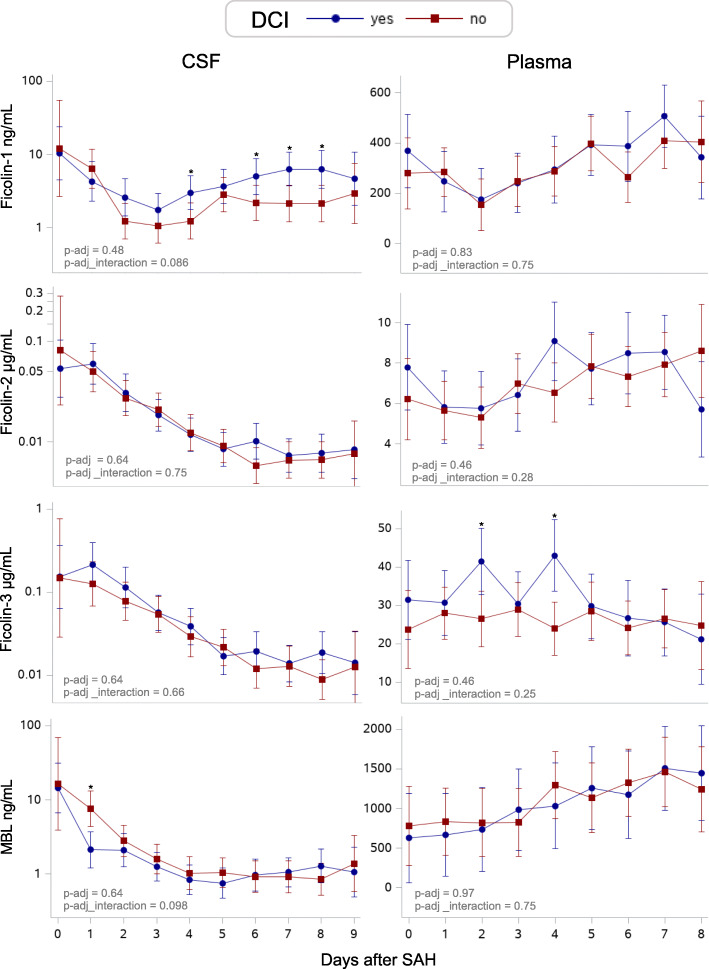
Fig. 2.
Predicted daily LCP initiator levels in SAH patients with or without the development of DCI. Predicted daily levels of ficolin-1, ficolin-2, ficolin-3, and MBL in CSF (left) and in plasma (right) in patients with (blue) or without (red) the development of DCI. The predicted daily levels are presented as medians in CSF and as means in plasma. Error bars show 95% confidence intervals. P values shown in the bottom left of each graph are adjusted for confounders (age, sex, WFNS, and Fisher score) and multiple testing (Benjamini-Hochberg procedure) and represent the overall difference in concentration between groups (p-adj) and overall different development over time (p-adj_interaction) for each LCP initiator. Asterisks indicate (*) significant levels on specific days <0.05. Each LCP initiator graph is based on a total number of 241 CSF samples from 36 SAH patients (mean number of samples per patient, 7; range, 6–8) and 233 plasma samples from 33 SAH patients (mean number of samples per patient, 7; range, 6–8). LCP: Lectin complement pathway, MBL: Mannose-binding lectin, CSF: Cerebrospinal fluid, CT: Computed tomography, DCI: Delayed cerebral ischemia, SAH: Subarachnoid hemorrhage

