Fig. 5.
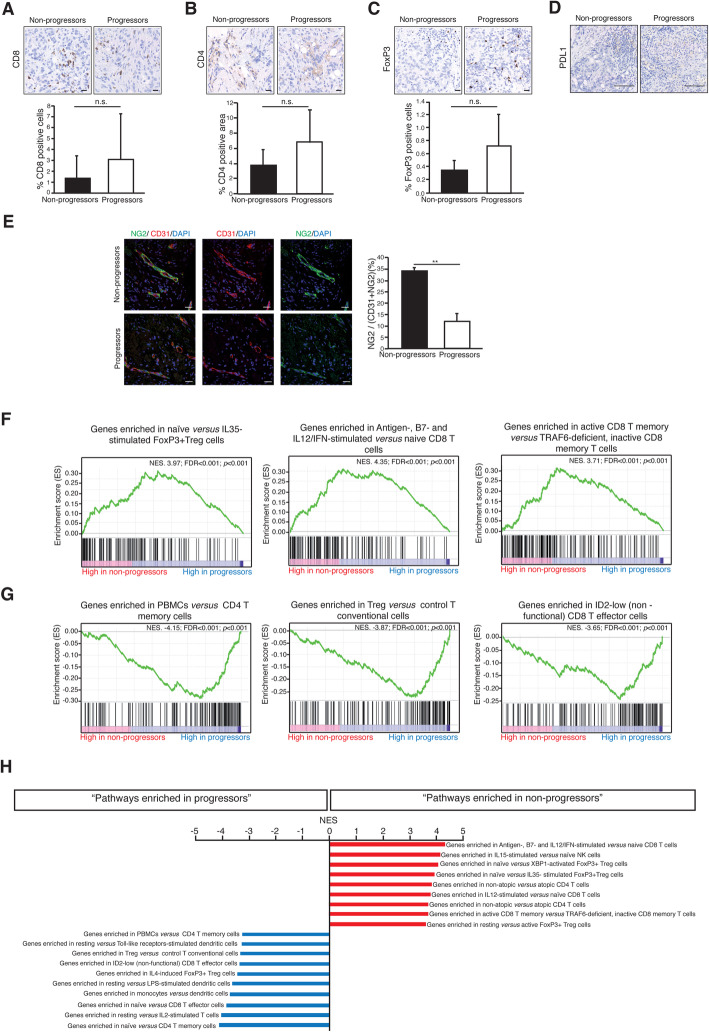
Tumor tissue immunodynamics and gene expression studies suggest immuno-priming by bevacizumab. Representative immunohistochemistry images of a CD8+ infiltration, b CD4+ infiltration, and c Treg infiltration in tumors from non-progressor and progressors patients (upper panels). The lower panels represent the geometric mean and standard deviation of the quantitation data from all available tumor biopsies. d The six analyzed tumors were negative for PD-L1 expression (applying the 1% boundary), regardless of experiencing benefit or not from the treatment combination. e Confocal imaging showing representative fields containing normalized blood vessels from a non-progression (the whole microvessel wall—CD31-positive endothelial cells—is covered by NG2-positive pericytes) and a progressor patient (who, in turn, displays vessel abnormality—lack of pericyte coverage and tortuous architecture). The chart represents the quantitative differences between the average percentage of microvessel wall covered by pericytes in non-progressors versus progressors; **P < 0.01. f Functionally representative GSEAs of the main regulated pathways in non-progressors’ tumors; NES, normalized enrichment score (the higher NES, the higher functional enrichment); both corrected (false discovery ratio (FDR)) and uncorrected P values are shown. g Same as in (f) for non-responders. h Further enriched GSEAs in responders and non-responders ranked by their NES; all of them with FDR < 0.001. Scalebars: a–c 20 μm; d 100 μm; e 25 μm

