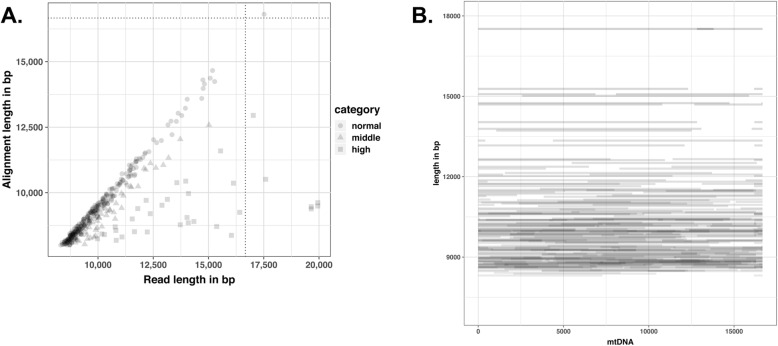
Fig. 4.
Mitochondrial long-reads. a Scatter plot of alignment and read lengths. Dotted lines represent the size of the mitochondrial genome. Each square, triangle or dot represents one read satisfying the following criteria: the read aligns to more than 8000 bp of the mtDNA reference sequence and more than 80% of the read aligns to the reference mtDNA sequence. Circles, triangles and squares label different read categories correspond to the ratio of read length over alignment length: « normal » for values less than 1.1, « middle » for values between 1.1 and 1.2, « high » for values over 1.2. Values higher than 1 mean that there are mutiple alignments between the read and the mitochondrial genome; possibly because the read spans more than one full turn of the mtDNA when the read is longer than the mtDNA or when it is « 2D like ». Most of these reads align as expected over their whole length to a single portion of the mtDNA reference sequence (circles that can be seen along the diagonal). A small portion of these reads (triangles and squares) show more complicated alignment figures with the mtDNA reference sequence. We called some reads « 2D like » because their sequence encompass the same mtDNA segment on the same or opposite orientation. b Long-read coverage display on the horse mitochondrial genome. Each horizontal grey bar corresponds to one read satisfying the criteria defined in a, and is displayed according to its length on the y-axis. The read matching mtDNA region is indicated by the span of the bar on the x-axis (mtDNA bp coordinates). Remark the longest read (17.5 kbp) that spans more than the length of the mtDNA with the region covered twice highlighted by the dark grey color

