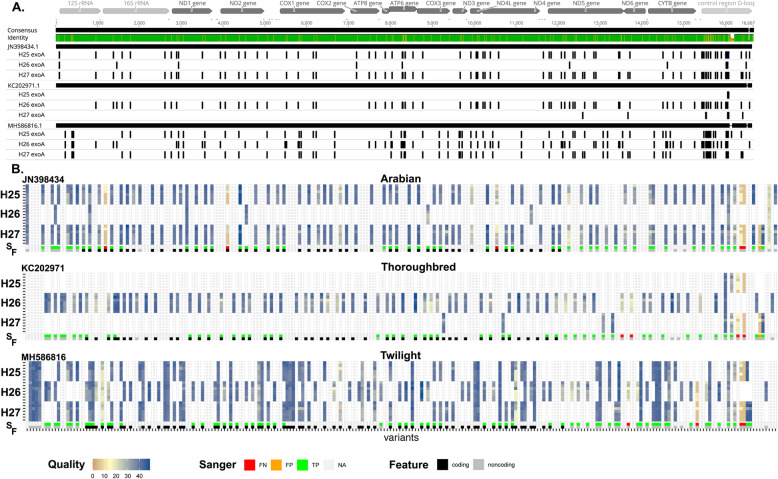
Fig. 5.
Variant calling from long mtDNA reads. a The top panel represents the mitochondrial genome with the scale in base pairs and its rRNA, tRNA, gene and control region features. The three mtDNA reference sequences were aligned to visualise their differences. Remark the significant differences in the control region. The position of the identified polymorphisms in the H25, H26 and H27 exoA samples are indicated just below as small black vertical lines. b The lower panel is an heatmap showing all variants identified along the mtDNA (from the left to the right) for the different samples indicated and the three different references (from top to bottom). Variants are coloured according to their quality score or are shown in white when they were not found in a given horse DNA. SNPs categories defined by comparison with Sanger sequencing are shown below the heatmap: false negatives (FN, in red), false positives (FP, in orange) and true positives (TP, in green). Coding SNPs are shown in black in the last row, while non-coding SNPs are shown in grey

