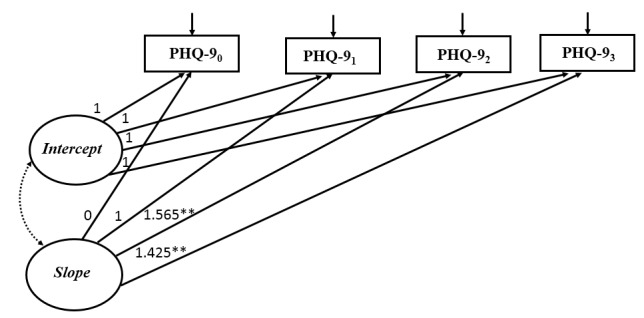
Figure 1.

Unconditional latent growth curve model for depressive symptoms (n=150). Model fit statistic: χ2=7.0, P=.07, degrees of freedom=3; CFI=0.975, TLI=0.949, SRMR=0.039, RMSEA=0.094. Observed variables were indicated by boxes and latent variables were indicated by ovals. Unidirectional arrows indicated the effect of one variable on another and bidirectional arrows indicated correlations. The nonsignificant path was indicated by dotted line. 0: baseline; 1: 1 month after baseline; 2: 2 months after baseline; 3: 3 months after baseline; *P<.05, **P<.001.
