
Figure 2.
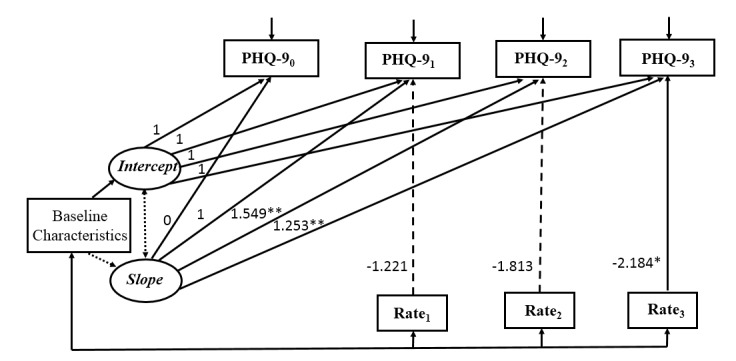
Conditional latent growth curve model for depressive symptoms with completion rate as the measure of patient engagement (n=150). Model fit statistic: χ2=13.0, P=.79, degrees of freedom=18; CFI=1.000; TLI=1.000; RMSEA<0.001; SRMR=0.030. Baseline characteristics included education, income, and duration of HIV infection. Observed variables were indicated by boxes and latent variables were indicated by ovals. Unidirectional arrows indicated the effect of one variable on another and bidirectional arrows indicated correlations. Nonsignificant paths were indicated by dotted lines. Rate: completion rate; 0: baseline; 1: 1 month after baseline; 2: 2 months after baseline; 3: 3 months after baseline; *P<.05, **P<.001.