Figure 3.

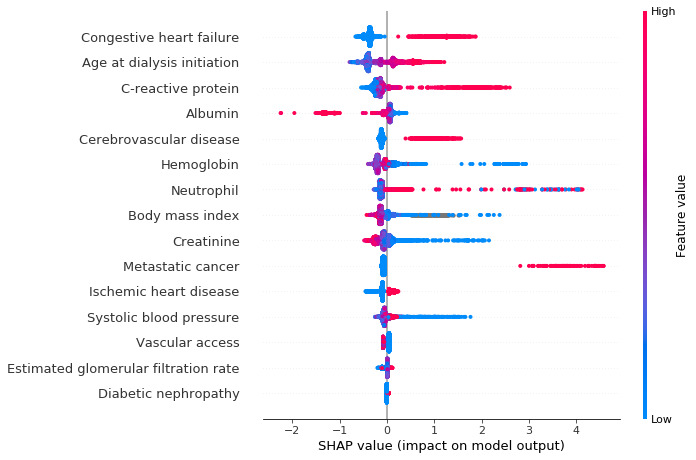
SHAP values illustrating how features contribute to model 1. Blue shows a negative contribution, and red shows a positive contribution. SHAP: Shapley additive explanation.

SHAP values illustrating how features contribute to model 1. Blue shows a negative contribution, and red shows a positive contribution. SHAP: Shapley additive explanation.