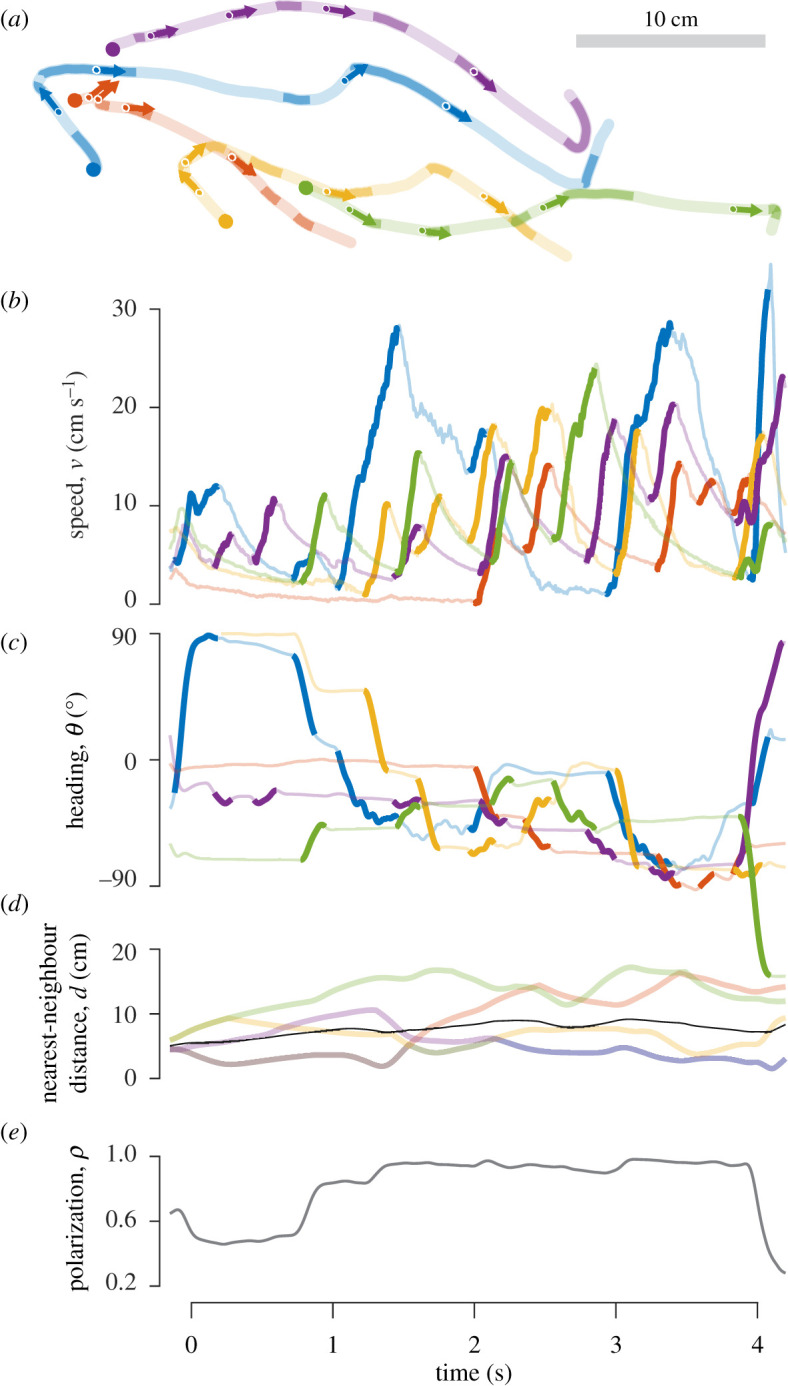
Figure 1.

High-speed kinematics of a school of fish swimming intermittently. (a) The trajectory of each fish is displayed with a unique colour, with periods of acceleration indicated by dark curves and decelerations shown in light colours, starting at each filled circle. The arrows indicate the heading of a fish at regular (1 s) intervals, starting at 0.5 s. (b–e) Time series of measurements for the trajectories shown in a. (b) Periods of bursts (dark curves) and coasts (light curves) were found with an automated approach from these measurements of speed. (c) Variation in heading reflects the intermittent changes in direction that were correlated with the bursting phase. (d) The nearest-neighbour distance is indicated with curves that show the shared values between neighbours and the mean among all members (black curve). (e) Polarization was calculated from the heading values in c (equation (2.1)) and indicates the common alignment of fish in the group. (Online version in colour.)
