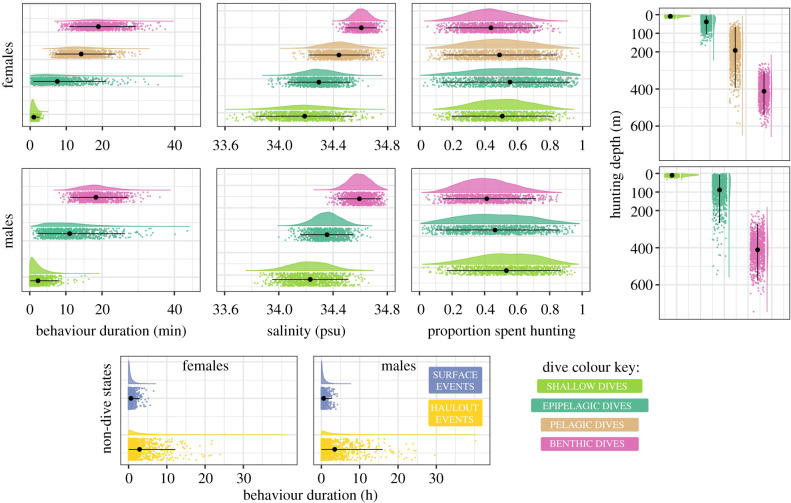
Figure 2.
State density distributions for dive states (shallow, epipelagic, pelagic, and benthic dives) in female (top row) and male (middle row) Weddell seals. The state density distributions for non-diving states (haulout, surface) are shown for females (left) and males (right) in the bottom row. The density distributions are colour-coded by state, with a cloud of points below them. The cloud represents a realization of the estimated state-dependent distribution, based on a sample of 1000 points. The black point and line going through each coloured cloud of points represent the mean estimated by the model and the interval covering 95% of the probability mass. In females, all four dive states are present, while in males there are three dive states (no pelagic dives). (Online version colour.)

