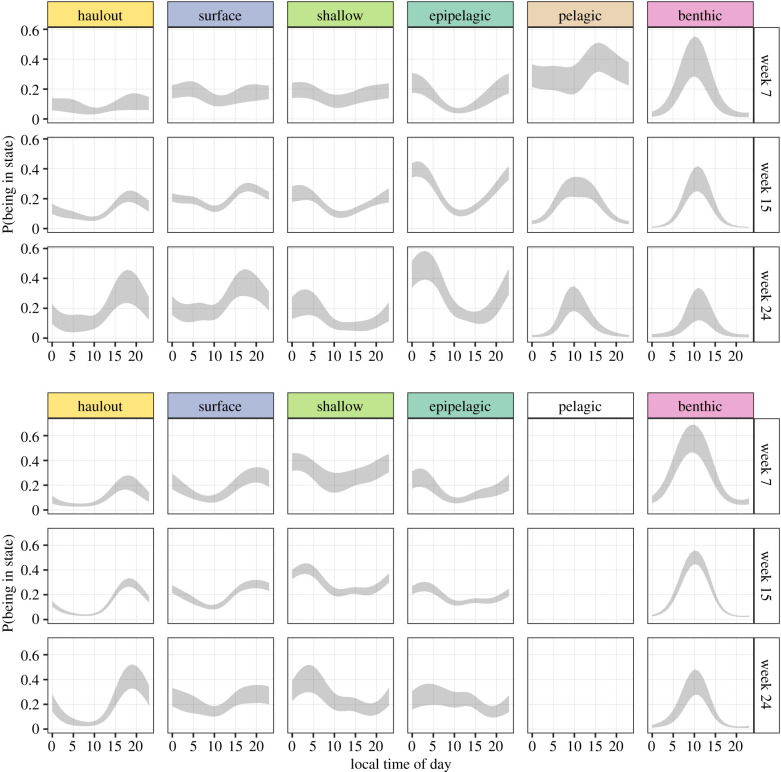
Figure 3.
The probability (y-axis) of finding a seal in a given state (columns), during a week of the year (rows) throughout the 24-h cycle (x-axis). The grey ribbon represents the area enclosed by the lower and upper confidence bounds of the 95% interval of the estimated effect, which were calculated using the delta method. Time of day corresponds to local time calculated from the location of each data point. The female plots are shown in the top panel, and the males’ in the bottom panel. Week 7 corresponds to late summer, week 15 to autumn, and week 24 to midwinter. (Online version colour.)

