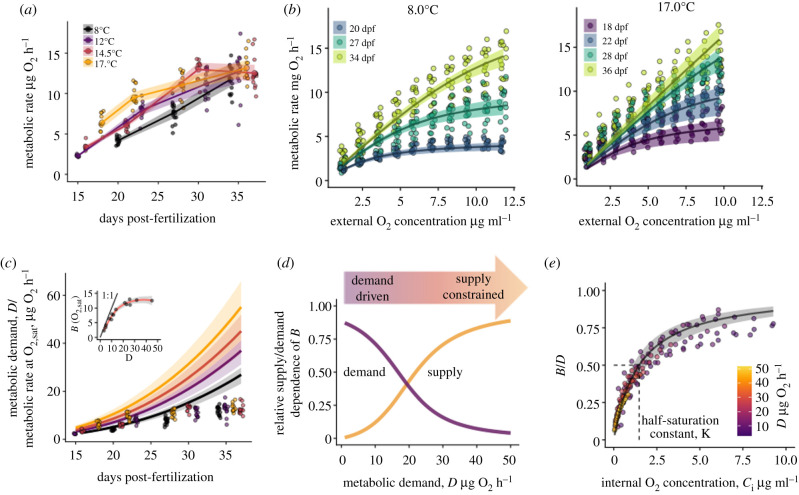
Figure 1.
Measuring and modelling O2 supply and demand in developing salmon embryos (a) Measured metabolic rates of salmon embryos at O2 saturation depended on development stage and temperature: replicate eggs (small circles), treatment means (large circles, lines) and 95% CI (bands). (b) Observed metabolic rates of individual eggs (circles) as a function of O2 in the respirometry chamber at intervals of 10% saturation. The developmental stages of experimental embryos (days post-fertilization) are denoted by colour. Lines represent predictions of the biophysical model (95% CI: bands). The two panels show data from the highest and lowest experimental temperatures; data for all experimental temperatures are shown in electronic supplementary material, figure S1 (c) The estimated metabolic demand, D, of embryos increases rapidly with temperature and development day (lines; bands depict 95% CI), while the observed metabolic rate in normoxia plateaus (points, same data as panel (a). Inset shows the measured realized metabolic at saturated O2 as a function of the estimated demand. Points represent treatment means for each temperature development day combination (n = 15). (d) As the metabolic demand of embryos increases their metabolism switches from being demand driven to supply constrained. Shown is the relative dependence of realized metabolic rate, B, on metabolic demand, D, and supply, Co, as a function of D, in normoxia; 0 and 1 denote complete independence and proportional dependence respectively (see electronic supplementary material, appendix A1 for calculation). (e) Mean observed metabolic rates, B, scaled by D, across all temperatures, development stages and external O2 concentrations (points), collapse to a single Michaelis–Menten relationship a function of the within-egg O2 concentration. Line shows the model-predicted Michaelis–Menten relationship (bands: 95% CI). (Online version in colour.)

