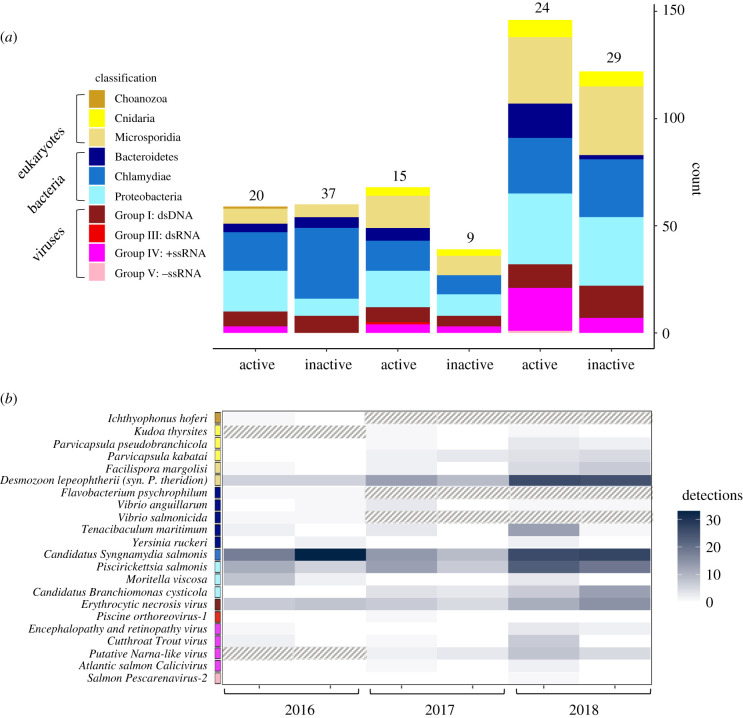
Figure 2.
Raw qPCR detections of pathogen eDNA separated by phylum (a) and subdivided by species (b) at active and inactive sites across all three sampling years (2016–2018). Coloured boxes next to pathogen species indicate the phylum (eukaryotes and bacteria) or Baltimore class (viruses) classification group that each pathogen belongs to. The colour of pathogen species' cells (b) indicates the number of detections of each species by site status and sampling year. Cells with a pattern fill indicate pathogen species that were not tested in that sampling year. Numbers above stacked bars (a) indicate the number of active and inactive sites sampled in each year. (Online version in colour.)

