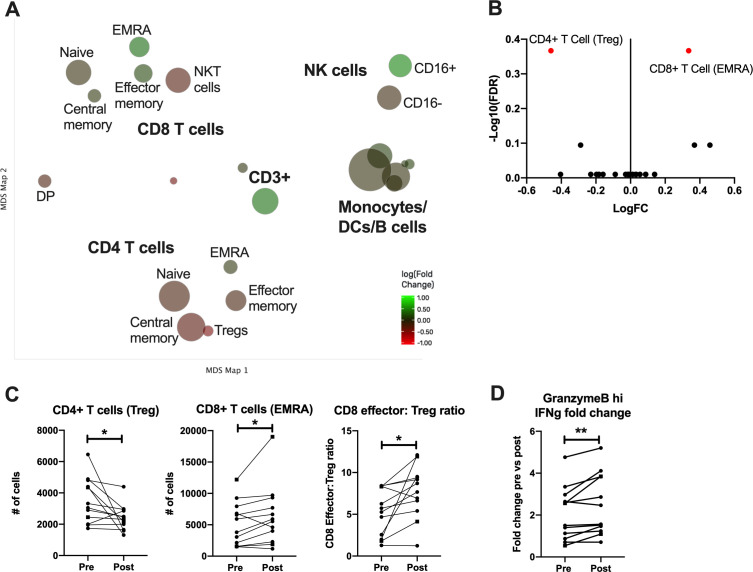
Figure 2.
CYTOF analysis of PBMCs restimulated with CEA from patients prevaccination and postvaccination. (A) Cells were clustered and visualized using MDS. Each cluster is colored based on magnitude of fold change from the prevaccine to postvaccine sample after restimulation with TRICOM-CEA. (B) Volcano plot of identified cell clusters from (A), showing those with a significant p value in red. (C) Number of cells in each indicated cluster or the ratio of activated CD8 T cells to Tregs paired for each patient prevaccination and postvaccination. Samples from patients with colorectal cancer are shown as dashed lines with square symbols. (D) The fold change in IFN-γ production by granzyme B hi CD8 T cells post-TRICOM-CEA restimulation paired for each patient prevaccination and postvaccination. *P<0.05 **p<0.01. CEA, carcinoembryonic antigen; CYTOF, cytometry time of flight; MDS, multidimensional scaling; PBMS, peripheral blood mononuclear cell; VRP, virus-like replicon particle.

