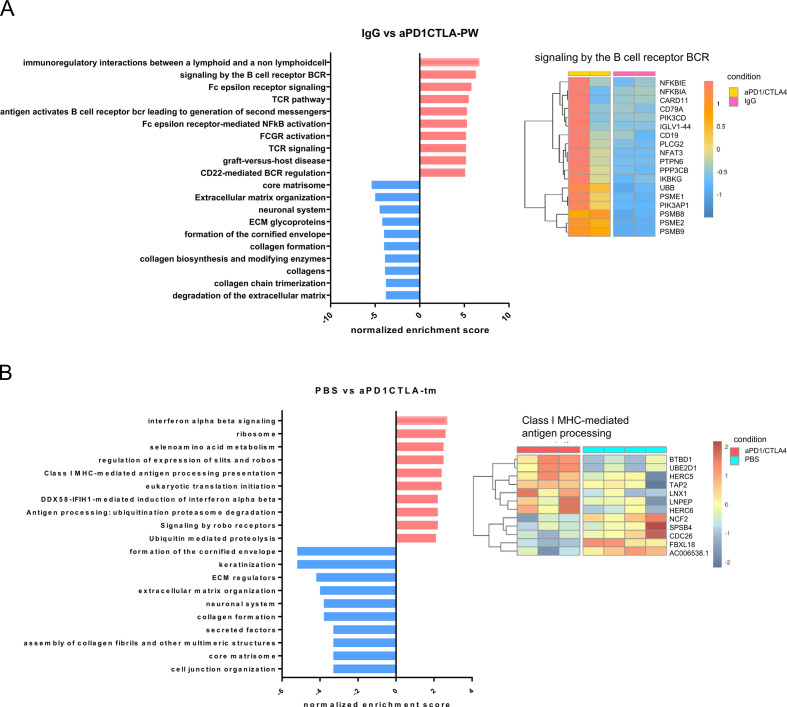
Figure 6.
GSEA showing the top 10 enriched pathways responded to dual anti-PD1/CTLA4 blockade. (A) Bar plots showing the Normalized Enriched Score (NES) of the top 10 upregulated (red) and downregulated (blue) pathways in the peritoneal wash samples from mice treated with dual anti-PD1/CTLA4 blockade relative to IgG control. Representative heatmap showing one of the upregulated pathways (right panel). (B) Bar plots showing the NES of the top 10 upregulated (red) and downregulated (blue) pathways in the tumor samples from mice treated with TALs plus anti-PD1/CTLA4 blockade relative to PBS control. Representative heatmap showing one of the upregulated pathways (right panel). GSEA, gene set enrichment analysis; TALs, tumor-associated leukocytes.

