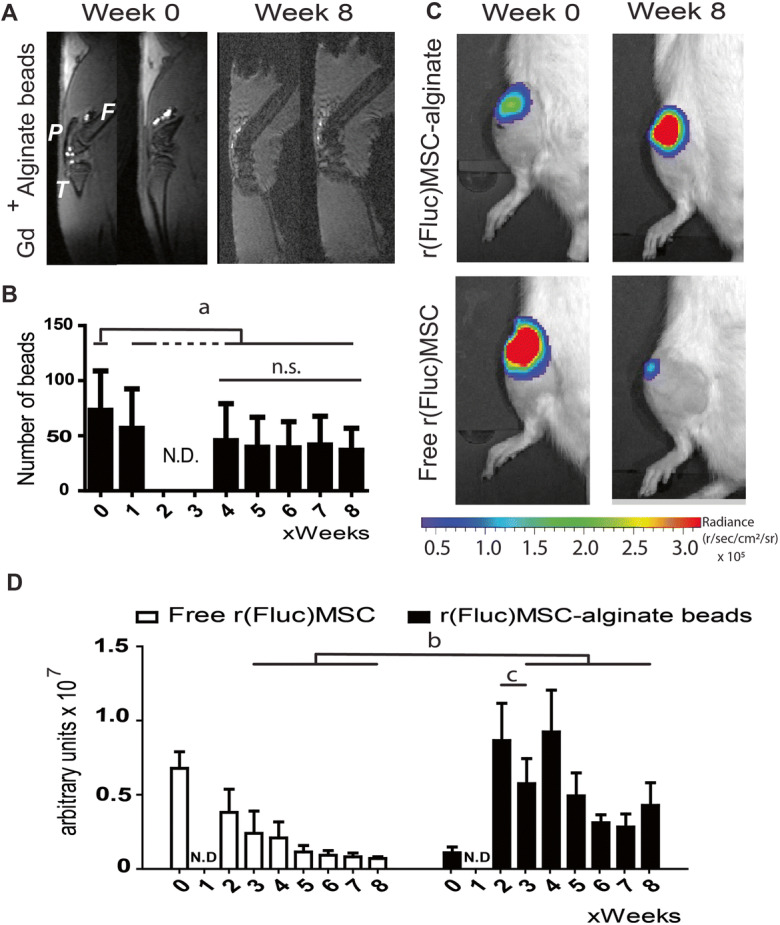
Fig. 5.

In vivo cell tracking. a MRI of rat knee joints injected with gadolinium-labelled alginate beads, directly after intra-articular injection and after 8 weeks. b Quantification of the number of alginate beads per joint over time. (Due to technical problems with the MRI scanner, week 2 and 3 scans were not available). c BLI of free r(Fluc)MSC and r(Fluc)MSC-alginate bead directly after injections and after 8 weeks. d Quantification of BLI signal over time (due to technical problems with the IVIS, week 1 scans were not available). The images shown in a and c are representative animals for each group. In a: P = patella, F= femur, T = tibia. In d: white bars = free (Fluc)MSC and black bars = r(Fluc)MSC-alginate beads. (b, p < 0.04; c, p = 0.028). n = 8 knees for free r(Fluc)MSC and n = 6 knees for r(Fluc)MSC-alginate group. N.D. = not determined due to technical error. n.s. = not significant
