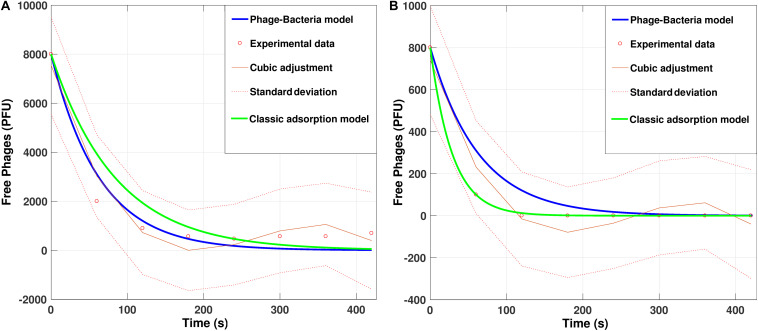
FIGURE 6.
Simulation for adsorption dynamics of the phage PvB on Vibrio ordalii versus experimental data using default parameters with (A) 8000 phages and (B) 800 phages. Cubic adjustment (with R = 0.9560 for (A) and R = 0.9356 for (B) and classical model curves (using the methodology proposed by Hyman and Abedon, 2009) were included for comparison.

