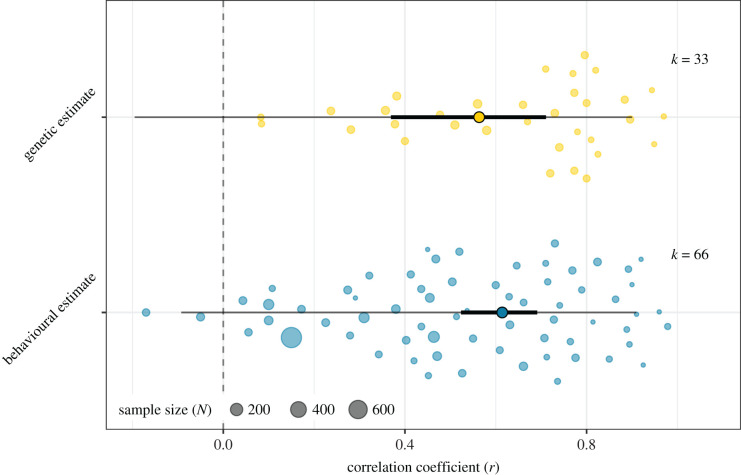
Figure 1.
Orchard plot [58] showing a positive correlation of testes size with genetic (r = 0.56, Z = 4.99, p < 0.001) and behavioural (r = 0.61, Z = 10.42, p < 0.001) estimates of sperm competition. The coloured dots present individual effect sizes, scaled by their precision, and model estimates are indicated by solid points outlined in black. Effect sizes and model estimates are back-transformed from Zr to r for easier interpretation. The 95% confidence intervals (solid black lines) do not overlap with zero (dotted grey line), and the 95% prediction intervals (solid grey lines) show that the ranges of values that can be expected from future studies are largely positive. (Online version in colour.)

